Experts Matter. Find Yours.
Connect for media, speaking, professional opportunities & more.

Trump, the Capitol, and Social Media – Let our expert answer the questions everyone is asking
Social media played a significant role in the storming of the U.S. Capitol, and its influence in shaping American politics is unlikely to wane, says UConn's Marie Shanahan. And that’s why UConn recently published a piece where Professor Shanahan took on a lot of the trickier questions people are asking in the wake of the storming of the U.S. Capitol on January 6. In a piece just published – she addresses these key questions: While obscure social media platforms like Parler, Gab, and Telegram have gotten a lot of attention recently as gathering places for the kinds of far-right activists who were instrumental in what happened at the Capitol, most of the planning for that event seems to have taken place in the open, on sites like Facebook and Twitter. To what extent was this event a product of social media? It’s hard to talk about Donald Trump’s presidency without talking about social media. What might change now that he seems to have been permanently banned from the most popular platforms? Speaking of that deplatforming, even though Facebook and Twitter can ban any user who violates their terms of service, is there some validity to the argument that in doing so they’re restricting free speech? What kinds of things can be done to address some of these problems in how the public discourse is shaped? Is repealing Section 230 actually a good idea? The piece is attached and it is an insightful must-read for anyone following these developments. Professor Shanahan is an expert in the intersection of journalism and digital communication technology, online news, and digital discourse. If you are a journalist looking to cover this topic and would like to arrange an interview with Professor Shanahan – simply click on her icon now to arrange a time to talk today.


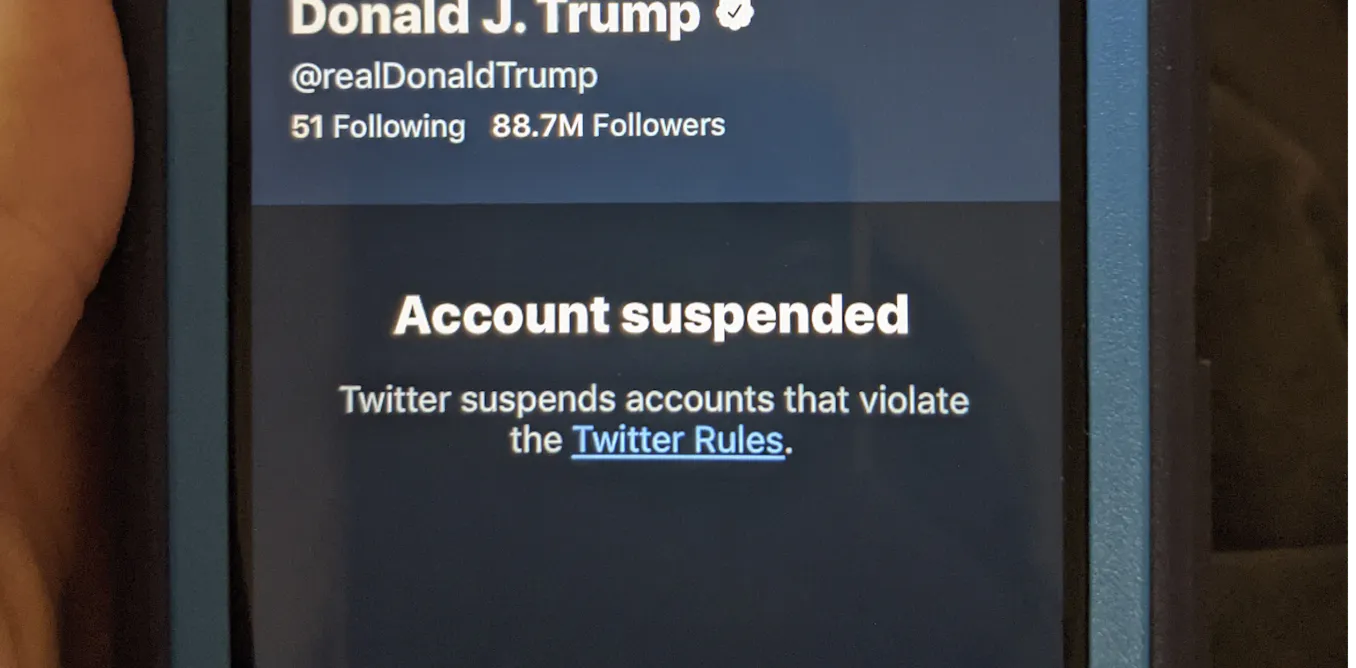
After an incited and encouraged crowd of Trump supporters stormed the Capitol buildings last earlier this month – social media, or at least the executives that run companies like Twitter and Facebook had had enough and opted to oust President Donald Trump from their platforms. Donald Trump has been ‘deplatformed’ and no longer has easy access to an audience of millions of followers. The concept of deplatforming is being widely debated. And recently, University of Connecticut’s Ugochukwu Etudo was asked to lend his expert perspective on the idea. Does the deplatforming of prominent figures and movement leaders who command large followings online work? That depends on the criteria for the success of the policy intervention. If it means punishing the target of the deplatforming so they pay some price, then without a doubt it works. For example, right-wing provocateur Milo Yiannopoulos was banned from Twitter in 2016 and Facebook in 2019, and subsequently complained about financial hardship. If it means dampening the odds of undesirable social outcomes and unrest, then in the short term, yes. But it is not at all certain in the long term. In the short term, deplatforming serves as a shock or disorienting perturbation to a network of people who are being influenced by the target of the deplatforming. This disorientation can weaken the movement, at least initially. However, there is a risk that deplatforming can delegitimize authoritative sources of information in the eyes of a movement’s followers, and remaining adherents can become even more ardent. Movement leaders can reframe deplatforming as censorship and further proof of a mainstream bias. There is reason to be concerned about the possibility that driving people who engage in harmful online behavior into the shadows further entrenches them in online environments that affirm their biases. Far-right groups and personalities have established a considerable presence on privacy-focused online platforms, including the messaging platform Telegram. This migration is concerning because researchers have known for some time that complete online anonymity is associated with increased harmful behavior online. In deplatforming policymaking, among other considerations, there should be an emphasis on justice, harm reduction and rehabilitation. Policy objectives should be defined transparently and with reasonable expectations in order to avoid some of these negative unintended consequences. January 15 – The Conversation If you’re a journalist covering deplatforming and would like to talk with Ugochukwu Etudo – simply click on his icon today and we’ll arrange an interview today.

Exploring the direct link between drug abuse and the internet
Drug overdoses account for a staggering number of deaths in the United States. In 2017 alone, more than 70,000 U.S. citizens died from opioid overdoses, a number that eclipses the death toll due to traffic accidents, gun violence, or HIV in the same year. Among the academic community, media and national organizations such as the Drug Enforcement Agency (DEA) and the Food and Drug Administration (FDA), there is a growing consensus that the internet plays a key role in enabling access to illicit drugs in America. As far back as 2005, the DEA referred to the internet as an “open medicine cabinet; a help-yourself pill bazaar to help you feel good.” But until now, the jury has been out about whether online platforms actually drive substance abuse among internet users. Research by Anandhi Bharadwaj, vice dean for faculty and research and Roberto C. Goizueta Endowed Chair in Electronic Commerce, along with doctoral candidate Jiayi Liu 22PhD, casts compelling new light on this issue. Their paper, Drug Abuse and the Internet: Evidence from Craigslist, was published in March 2020. By using data from Craigslist, one of the largest online platforms for classified advertisements, the researchers found a significant uptick in drug abuse in areas where Craigslist had become active in the last decade or so. Launched in San Francisco in 1995, Craigslist is a location-specific site that has been spreading to different U.S. cities in a staggered fashion since 2000. As the site has grown, so too have the number of illicit, user behaviors that exist in tandem with the many positive services it offers. Among these are prostitution and the sale of controlled or illicit drugs. The internet: a pipeline for narcotics Historically the sale and purchase of illegal drugs has happened in physical spaces—streets and urban areas prone to certain boundaries and limitations, not to mention the risk of arrest or potential violence. The internet has changed the game in two key ways. First, there is the simple mechanism of buyer-seller matching. Dealers and buyers transact online, which is more straightforward, faster and cuts through many of the risks associated with physical interaction. Simply put, it’s easy to buy drugs online. Second, there is the issue of anonymity. Research has documented how human beings behave differently when we believe our identity is shielded from others. We are prone to take more risks under the cloak of anonymity. Working off these two premises, Bharadwaj and Liu hypothesized that the internet not only facilitates the sale and purchase of drugs—it must also proactively spur supply and demand. To put this to the test, they documented the U.S. cities and counties where Craigslist has become operational since 2000 and then analyzed three other key variables: total number of people admitted into drug treatment facilities in different counties between 1997 and 2008, county-level drug abuse violations, and number of deaths caused by overdose per county. Eager to understand how this new access to drugs online might also be impacting people at a demographic and socioeconomic level, the researchers merged this data with statistics on age, ethnicity and poverty from the U.S. Census Bureau. Additionally, the authors compiled information about income and unemployment, crime and arrests from the Bureau of Labor Statistics and the FBI respectively. What they found was stunning. Not only is there a marked increase in drug-related treatments (14.9 percent), violations (5.7 percent) and deaths (6.0 percent) wherever Craigslist becomes operational in a city or county; the momentum of increasing drug abuse also continues to grow over time in that area. And that’s not all. Economic disadvantages—poverty, unemployment and lower standards of education—are typically associated with a higher risk of substance abuse. But the findings suggest that in fact it’s the wealthier, higher-educated groups—especially among whites, Asians, and women—that are more likely than others to engage in drug abuse once Craigslist starts operating in an area. In fact, they conclusively found an uptick in this kind of behavior where crime and drug abuse had been less prevalent previously. In other words, where drugs are becoming readily available online, there is a dramatic increase in new and first-time users. If you are interested in learning more or if you are a journalist looking to cover this research – then let our experts help. Professor Anandhi Bharadwaj is the Vice Dean for Faculty and Research and the Goizueta Endowed Chair in Electronic Commerce and Professor of Information Systems, Operations Management. To arrange an interview with – simply click on her icon today.


Best-selling author Peter Singer talks with the Brunswick Review about winning the increasingly crowded and contentious war for attention What do Isis and Taylor Swift have in common? According to author and digital-security strategist Peter Singer, both the terrorist organization and pop star are fighting for your attention online and employing similar tactics to try and win it. ISIS kicked off its 2014 invasion of Mosul with the hashtag, “#AllEyesonISIS.” More recently, the terror group posted photos of its members holding cute cats in an effort to make them more relatable – tactics familiar to most celebrities and online marketers around the world. These online battles, the rules governing them, and their real-world impact are the focus of Mr. Singer’s latest book, LikeWar, which he coauthored with Emerson T. Brooking, at the time a research fellow with the Council of Foreign Relations. “A generation ago people talked about the emergence of cyber war, the hacking of networks. A ‘LikeWar’ is the flip side: the hacking of people and ideas on those networks. Power in this conflict is the command of attention,” says Mr. Singer, who in addition to his writing is also a strategist and Senior Fellow at the New America Foundation. Pretty much everyone who posts online – from governments to marketers to reality TV stars – is a combatant in this fight for virality, according to Mr. Singer. Triumph in a “LikeWar” and you command attention to your product or propaganda or personality. Lose and you cede control of the spotlight and the agenda. Mr. Singer recently spoke with Brunswick’s Siobhan Gorman about the trends he’s seeing in LikeWars around the world, and what companies can do to avoid being on the losing end. What were you most surprised by in researching LikeWar? One of the more interesting characters in the book was at one time voted TV’s greatest villain: Spencer Pratt, a reality TV star on MTV’s “The Hills.” He’s basically one of these people who became famous almost for nothing. But what Pratt figured out really early was the power of narrative, which allowed him to become famous through, as he put it, “manipulating the media.” In the same week, I interviewed both Pratt and the person at the US State Department who’s in charge of the US government’s efforts to battle ISIS online. And Pratt, this California bro who’s talking about how to manipulate the media to get attention, understood more of what was playing out online than the person at the State Department. Spencer Pratt, a reality TV star… understood more of what was playing out online than the person at the State Department.” How much have online conflicts changed the rules in the last few years? First, the internet has left adolescence. It’s only just now starting to flex its muscles and deal with some of its responsibilities. The structure of the network changes how these battles play out. So, it’s this contest of both psychological but also algorithmic manipulation. What you see go across your screen on social media is not always decided by you. The rule makers of this global fight are a handful of Silicon Valley engineers. Another aspect of it is that social media has effectively rendered secrets of any consequence almost impossible to keep. As one CIA person put it to us, “secrets now come with a half-life.” Virality matters more than veracity; the truth doesn’t always win out. In fact, the truth can be buried underneath a sea of lies and likes. And the last part is that we’re all part of it. All of our decisions as individuals shape which side gets attention, and therefore which side wins out. But you highlight that this is playing out differently in China. Exactly. There are two different models shaping the internet, and shaping people’s behavior through the internet, playing out in the West and in China. Essentially, internet activity in China is all combined. Look at WeChat, which is used for everything from social media to mobile payment; it’s Amazon meets Facebook meets Pizza Hut delivery. And you combine that with an authoritarian government that’s had a multi-decade plan for building out surveillance, and you get the social credit system, which is like Orwellian surveillance crossed with marketing. The social credit system allows both companies and the government to mine and combine all the different points of information that an online citizen in China reveals of themselves, and then use that to create a single score – think of it as your financial credit score of your “trustworthiness.” For example, if you buy diapers your score goes up, because that indicates you’re a parent and a good parent. If you play video games for longer than an hour your score goes down because you’re wasting time online. And it’s all networked. Your friends and family know your score. It creates a soft form of collective censorship; if your brother posts something that’s critical of the government, you’re the one who goes to him and says, “Knock it off ’cause you’re hurting my score.” And you do that because the score has real consequences. Already it’s being used for everything from seating on trains and job applications to online dating. Your score literally shapes your romantic prospects. So, you have this massive global competition between Chinese tech companies and other global tech companies not only for access to markets, but also for whose vision of the internet is going to win out. How can companies win a “LikeWar”? Everyone’s wondering: What are the best ways to drive your message out there and have it triumph over others? The best companies I’ve seen create a narrative, have a story and have emotion – in particular, they have emotion that provokes a reaction of some kind. It’s all about planned authenticity. That sounds like a contradiction, but it’s about acting in ways that are genuine, but are also tailored because you’re aware that the world is watching you. A good comparison here is Wendy’s versus Hillary Clinton. Wendy’s is a hamburger chain – not a real person – but it acts and comes across as “authentic” online and has developed a massive following. They’re funny, irreverent. Yet Hillary Clinton – a very real person – never felt very authentic in her online messaging. And that’s because it involved a large number of people – by one account, 11 different people – all weighing in on what should be tweeted out. Inundation and experimentation are also key. Throwing not just one message out there, but massive amounts of them. Treating each message as both a kind of weapon, but also an experiment that allows you to then learn, refine, do it again, do it again, do it again. How do you measure and gauge battles online now? Is it just volume? It all depends on what your battle is, what your end goal is. Is it driving sales? Is it getting people to vote for you, to show up to your conference? This is what the US gets wrong about Russian propaganda and its disinformation campaigns. We think they’re designed to make people love or trust a government. From its very start back in the 1920s, the goal of propaganda coming from the Soviet Union, and today Russia, has been instead to make you distrust – distrust everything, disbelieve everything. And we can see it’s been incredibly effective for them. First, we need to recognize that we’re a part of the battle. In fact, we’re a target of most of the battles. How effective have disinformation campaigns actually been in the US? What can be done? One of the scariest and maybe saddest things we discovered is that the US is now the story that other nations point to as the example of what you don’t want to have happen. There’s no silver bullet, of course. But one example was something called the Active Measures Working Group, a Cold War organization that brought together the intelligence community, diplomats and communicators to identify incoming KGB disinformation campaigns and then develop responses to them. We’re dealing with the modern, way more effective online version of something similar, and we haven’t got anything like that. There are also digital literacy programs. I find it stunning that the US supports education programs to help citizens and kids in Ukraine learn about what to do and how to think about online disinformation, but we don’t do that for our own students. What can people like you or me do? First, we need to recognize that we’re a part of the battle. In fact, we’re a target of most of the battles. And we need to better understand how the platforms work that we use all the time. A majority of people actually still don’t understand how social media companies make money. The other is to seek out the truth. How do we do that? And the best way is to remember the ancient parable of the blind man and the elephant – don’t just rely on one source, pull from multiple different sources. That’s been proven in a series of academic studies as the best way to find the facts online. It’s not exactly new, but it’s effective. Where will the next online war be fought? The cell phone in your pocket, or if we’re being futuristic, the augmented reality glasses that you wear as you walk down the street. It’ll come from the keepsake videos that you play on them. If you want to know what comes next in the internet there have always been two places to go: university research labs and the porn industry. That’s been the case with webcams, chat rooms and so on. What we’re seeing playing out now are called “deep fakes,” which use artificial intelligence to create hyper-realistic videos and images. There’s also “madcoms,” which are hyper-realistic chat bots that make it seem like you’re talking to another person online. Combine the two, and the voices, the images, the information that we’ll increasingly see online might be fake, but hyper-realistic. The tools that militaries and tech companies are using to fight back against the AI-created deep fakes are other AI. So, the future of online conflict looks like it’ll be two AIs battling back and forth. Let me give you a historic parallel, because we’ve been dealing with these issues for a very long time. The first newspaper came when a German printer figured out a way to monetize his press’s downtime by publishing a weekly collection of news and advice. And in publishing the first newspaper, he created an entire industry, a new profession that sold information itself. And it created a market for something that had never before existed – but in creating that market, truth has often fallen by the wayside. One of the very first newspapers in America about a century later was called the New England Courant. It published a series of letters by a woman named Mrs. Silence Do-good. The actual writer of the letters was a 16-year-old apprentice at the newspaper named Benjamin Franklin, making him the founding father of fake news in America. In some sense it’s always been there, using deception and marketing to persuade people to your view.


Why posting to multiple channels drives virality of online videos
Back in the summer of 2012, South Korean pop star Psy released a music video on YouTube. Running at just under four minutes, “Gangnam Style” rapidly became a global sensation. Within just two months of its release, the video was attracting a daily average of nine million viewers. In late September, Guinness World Records confirmed it to be the “most liked” video on YouTube. By December it had become the first piece of content on the platform to garner more than one billion views. As of 2020, the Gangnam Style video has been seen by more than 3.7 billion people around the world. Pys’s official YouTube channel has around 14.1 million followers—a significant user base. But even assuming that each one of these followers had watched the video several times and shared it with others, it still doesn’t account for the sheer volume of views the video has racked up over time. So what’s going on? What is behind the super virality of Gangnam Style and other pieces of content that, like it, appear to defy the rules of probability on the social web? Rajiv Garg, associate professor of information systems & operations management at Emory’s Goizueta Business School, has put a new hypothesis to the test. And he’s found that there’s a clear link between virality and what he calls the “spillover effect” of posting content onto multiple platforms at specific times. “We know that when celebrities and popular figures post videos, there’s likely to be a strong response from their follower base, depending on the content. But over time, user consumption reaches a saturation point—the novelty simply wears off. And this happens around 10 days after a video is posted,” Garg said. “Yet some videos just keep on going, getting successive waves of views on the same platform in quantities that eclipse the follower base. We hypothesized that this is affected by launching on different sites and platforms, but we really wanted to understand the mechanisms behind this and figure out why this activity was occurring on the original platform as well as others—as in the Gangnam case.” Together with Vijay Mahajan (McCombs, UT Austin) and Haris Krijestorac (HEC Paris), Garg looked at the diffusion patterns for viral content on the social web. First analysis confirmed that content sharing by users was the chief primary driver of virality; indeed, views typically increased after a video would appear on a second or third platform. But this didn’t explain why those views were growing back on the original platform too. In fact, the finding ran contrary to the established view that platforms compete for content—that posting to one platform leeches user views from another. “The reasoning until now has been that social platforms cannibalize content. In other words, when you post Gangnam Style onto Vimeo, you’ll get fewer views on YouTube as a result,” Garg said. “Users will move to the other platform and watch it there instead.” But in fact, the opposite was happening. Intrigued, Garg and his coauthors deployed synthetic control—a comparative statistics methodology—to test the causal effects of sharing content to one platform versus posting it to multiple sites. This methodology involved posting 381 viral videos on 26 video-hosting sites. In addition, they ran a randomized field experiment with 30 videos that were randomly seeded onto new platforms at random times. The results across both methods were consistent. Users who were finding the videos once they had been posted to a second (or third, or fourth) platform were still sending viewers to the original platform to view the content. And viewers were coming in droves. “What seems to be happening is that content is going viral as it’s consumed on the original platform—YouTube, say—and then shared to other channels. Here, on the second channel—Vimeo, Daily Motion or others—these videos reach new audiences,” explained Garg. “But for whatever reason, once they’ve discovered the video, many of these new users prefer to go to the original channel and watch it there. And this is happening consistently and in highly significant numbers of users.” This spillover effect could be due to a number of things, says Garg. It could be that for certain audiences, content is simply more readily discoverable on certain platforms—but that these platforms are not the first choice in viewing preferences. It could also be that the content is visible to users but not viewable on the second platform. “Say Gangnam Style is seen on YouTube by a viewer and shared. It then appears on Vimeo, and a second user discovers it; but maybe this user doesn’t like Vimeo or perhaps Vimeo isn’t available in their region or country. What happens then?” noted Garg. “The simple answer is that these new users end up Googling Gangnam Style and find it on YouTube—the original platform. The novelty and virality of the first wave of users has died down, but this new wave of users comes in, creating a spillover effect that boosts the popularity of the video all over again.” Looking again at the results of their analyses, Garg and his colleagues were able to determine that the spillover effect is strongest immediately after a video is introduced onto a secondary platform, as well as at the 18- and 42-day marks. “We analyzed the effect of introducing a video onto a new platform on the increase in views it generates on the original platform over time,” said Garg. “It appears the spillover mechanism is strongest during the first week but experiences spikes later on. In the long-run, we were able to generate twice as many views back on the original platform as we would otherwise have expected. So the effect really is huge.” It is also limited, however. The researchers found diminishing impact in posting content to a succession of different platforms. By the time the video is shared to a fourth or fifth platform, Garg and his coauthors saw no returns. The findings are nonetheless hugely significant for content creators, he says. “We’ve seen that content shared on different platforms sends users back to the original, and that debunks the idea that online channels cannibalize each other’s content,” Garg noted. “And we’re able to say with precision that this effect is strongest during the first week with later spikes, suggesting these may be the best times to introduce content onto new platforms.” Content creators looking to ‘viralize’ their material would do well to take a strategic, omni-channel approach based on these insights, says Garg. Multi-platform sharing is an effective way of spreading word of mouth content and reaching new audience bases—and not just nationally, he stresses. “The effect is not limited to borders or languages. Savvy content creators can create their first ripple on a YouTube or Vimeo and, as the views start falling off, go on to propagate to a second or third channel, including foreign ones,” he said. “The spillover effect is just the same. Staging and staggering your content this way, you reach completely new audiences, many of whom will spill over onto your original platform.” If you are a journalist looking to cover this topic – then let our experts help with your story. Rajiv Garg from Emory’s Goizueta Business School is available to speak with media – simply click on his icon now to arrange an interview today.


With America less than two weeks away from one of its most unique and divisive elections in the country’s history – and as the polls tighten and the outcome seems to be coming a little more clear from the fog of a long campaign, some might be getting a little worried. The November 3rd outcome is far from determined, especially if anyone wants to think back four years when President Trump was a candidate that was expected to be routed by Hillary Clinton. But as Joe Biden’s campaign is showing strength in traditional Republican strongholds, the idea of voting down the ballot and the ripple effects of voter change has representatives from both the Senate and House of Representatives concerned. If the presidency is to be lost, holding power and keeping a strong presence in both houses is still a priority. Getting re-elected and staying employed is also an important factor for members of Congress and sitting Senators. The following few days may be a crucial time for a lot of candidates seeking election in traditional ‘red’ states to start thinking for themselves and even distancing their platforms and profiles away from the campaign for the White House. It’s not as easy as it may seem. And that’s where a political expert can assist when examining a few of the important angles: What consequences and risks are there for candidates who abandon the party line? Where is it happening now and who is most vulnerable? Is down-the-ballot voting really an issue or just more of a myth made up for media covering an already long election? If you are a journalist looking to cover this election trend or any other topic leading up to Election Day – then let our experts help. Dr. Rosalyn Cooperman, associate professor of political science at the University of Mary Washington and member of Gender Watch 2018, is an expert on women in politics. She is available to speak with media regarding this topic – simply click on her icon to arrange an interview.


Digital Media Consumption in Canada is Being Dramatically Impacted by the Coronavirus Crisis
A Canadian perspective on Comscore’s ongoing special investigation into how the COVID-19 pandemic is leading to significant audience and consumer behaviour changes across digital platforms. Insights from our Analysis: News, news and more news: Canadians are consuming news at a record pace Social media and messaging: Canadians are staying ultra-connected with their communities Entertainment, music, and spirituality content: increased consumption seen as behaviours change Government: information from government websites are becoming top-of-mind Finance: increased focus on investments and payments Analysis of News & Information Category We have seen an explosion on engagement with news and information sites. In looking at the news categories and its subcategories, the week of Mar 9-15, 2020 saw big increases in engagement over the benchmark week of Dec 30, 2019 - Jan 5, 2020. As a trend, news consumption in general is also on the rise in Canada in terms of aggregate daily unique visitors and visits over time. Analysis of Social Media and Messaging Category As Canadians respond to the Coronavirus reality, we are seeing that their engagement with digital communication channels has increased significantly. When comparing daily engagement with email, instant messengers and social networking sites between the week of March 9-15, 2020 and the benchmark week of Dec 30, 2019 -Jan 5, 2020 as it relates to the % change in usage, we saw large increase in activity. The raw increase in numbers in social media provides greater detailsof the growth in usage: Analysis of Entertainment, Misc and Religious / Spiritual Category Content is Queen, King, Prince, and Princess – between the weeks of Dec 30– January 5 and March 9-15, greater amounts of time at home and the associated increased screen time drove incremental usage of the Entertainment category and the Religious/Spiritual subcategory. Driving the growth is the explosion of Entertainment – Music, which saw an increase of 32% in aggregate daily UV, a 33% increase in visits, and a 31% increase in minutes during this time. Analysis of Government Category Another category that has seen an explosion of visitation and engagement is government sites. Overall there has been huge audience and time spent with government-related content. Here is the build of visits and aggregate Daily UV over the past 10 weeks: We reviewed the Government category between week of Dec 30, 2019 – January 5, 2020 to March 9 – March 15, 2020 and looked at the % change in usage, which really showed a large increase in activity by Canadians. Based on this trend and growing global cases of Coronavirus, it is expected that Canadian audiences will continue to flock to the content from the government in these uncertain times. Analysis of Finance Category There is a saying that we hear in society – “Follow the Money”. The digital behavior of Canadians has been analogous in recent weeks as we have seen increased measures taken relating to the Coronavirus. Overall the Business/Finance category has seen some increased usage over the time period reviewed. Banking, Payments, Investments, and especially Taxes have seen high visitation. Between the week of Dec 30, 2019 – January 5, 2020 to March 9 – March 15, 2020 we saw an increase of +19% and +59%, respectively, in visits in the Investments and Payments subcategories. Additional insights from Comscore’s initial COVID-19 insights for Canada show that: Overall Digital Consumption across the Total Internet has increased. During the time period of this review visits have increased by 10% and time spent has increased by 14% In a time of crisis, people turn to News/Information Websites There have been significant increases in activity by Canadians on Social Media, Email, and Messaging pointing to the need for communication. Social distancing is safe on the internet. Interest soars for government information sources – where we see an explosion of usage. Increases in certain content Categories like Entertainment, Games, Music, Dating, and Religion/Spirituality have spiked Spikes in traffic are occurring for the e-commerce giants as social distancing and local restrictions impact in-store retail – with specific focus on Food and Supermarket Global movement restrictions lead to tumultuous traffic for travel sites


Canadian's Digital Behavioral Shifts in Relation to the The Coronavirus Pandemic
This article is part of a series of insights that reveal a Canadian perspective on the impact of the COVID-19 pandemic on consumer behavior and significant audience shifts across digital platforms. Things are moving fast. Following our last update regarding digital media consumption during the Coronavirus pandemic, this article will highlight some of the major category changes reflected as of the week March 16 - 22, 2020. Key Insights from Our Analysis Digital consumption continues to grow: the visits and minutes curve is not flattening Key content categories such as news, social media, and government are being driven by higher engagement: metrics include visits and duration More engagement with news sites: sites categorized as local, business/finance, and general news are main drivers Categories that focus on entertaining, kids, food, financial advice, and children’s education are also seeing growth: growth comes from increases in aggregate unique visitors, visits and minutes Automotive manufacturers, real estate, sports and travel entities have seen decreases: however, they are poised for major increases and a bounce back. Mobile platforms are driving growth: some differences between desktop and mobile engagement Canadian's total digital consumption continues to grow When we analyzed Canadian total digital media consumption to compare the percentage change between the week of March 16, 2020 and the first weeks of January 2020, February 2020, and March 2020, we found that overall digital engagement is not flattening. Even comparing the beginning of March against mid-March, we can see visitation, visits, and engagement continuing to grow. Looking at the total digital consumption trend over time, we can see growth in total minutes spent online while total visits have remained relatively flat. Media Consumption Growth by Category There are several content categories that we are seeing major growth in each of the time periods: These digital categories of news/information, social media, entertainment, government and games are showing continuous growth. The need for ongoing news and information updates, government information, flocking to social media to bring community together and message, and the need to be entertained with visitation and engagement on Entertainment and Games Entities. News and Information Category Insights To look at the news/information category a bit closer – it is amazing to see the category growth over the past few weeks of Canadians going to news entities to get updates. The hockey stick growth from the start of March 2020 is very evident. The news and information growth is being driven by local news, general news, and business/finance news. That being said – technology, politics, and weather are also seeing growth. Through these time periods, we are also seeing some other categories that are showing significant growth. Many of the categories are a result of many Canadians being home bound and isolated, and with families with kids having the kids at home. Platform Variance for Media Consumption One of the areas that we have been asked most about is whether we find any variances between desktop and mobile platforms. When reviewing the data, there is greater engagement with mobile platforms in the week of March 16 compared to other weeks. Amidst the global COVID-19 pandemic, we are seeing a significant increase in digital consumption amongst Canadian consumers. The data trends show Canadians are flocking online with significant growth in news entities, instant messaging, social media, government resources, entertainment, music destinations, video, and financial websites. What this means for marketers and advertisers is a significant opportunity to reach Canadians who are highly engaged and are looking for relevant and timely content. It comes down to delivering the right message, at the right time, in front of the right audience, in brand safe environments.

Insights and Analysis of Canadian Digital Media Consumption During the Coronavirus Pandemic
In the midst of the COVID-19 crisis, millions of Canadians are staying home and turning to their computers, smartphones, and tablets as a core source of news, information, education, and entertainment. This article is part of a series of insights that reveal a Canadian perspective on the impact of the COVID-19 pandemic on consumer behavior and significant audience shifts across digital platforms. This week we will highlight some of the major category changes reflected as of the week March 23 - 29, 2020. Key Insights from Our Analysis: Digital consumption continues to grow, although at a slower pace Canadians are still consuming news at a record pace, but growth is slowing Sports and Real Estate declines are slowing Retail overall is stable but key categories like Toys, Apparel, and Books are increasing in consumption Canadian usage in Dating, Pets, Food, and Family & Youth Education on the rise Canada's Total Digital Population An analysis of Canadian Total Digital Media consumption looking at the percent change from week of March 23, 2020 to March 29, 2020 from the previous week of March 16, 2020 to March 22, 2020 showed continued increase of Unique Visitors (UVs), Visits, and Minutes, but does reveal that some increases are at a slower rate than previous weeks. Unique Visitors grew by +1%, Visits by +2%, and Minutes by +5%. At a top line that is still substantial growth, but throughout this release we will give insights into what is driving these increases, and in some cases highlight categories that are starting to show recovery. Analysis from the News and Information Category This category has been a huge focus over the past few releases given the amazing growth of Unique Visitors, Visits, and Minutes as COVID-19 became more prevalent in Canada. Canadians flocked to News/Information websites in record numbers driven by General News, Local News, Weather, and Politics. With that being said, during our latest week of data (week of March 23, 2020 to March 29, 2020) we have seen a lower percentage increase for the category. There is still growth, but the growth is at a slower rate. The category is still a huge area of focus and visitation and engagement are near record high levels. Analysis from the Retail Category The Retail category has also been a particular focus as bricks and mortar shopping has significantly changed, and in some places closed where they are deemed non-essential. Overall, the Retail category has seen a pretty flat line of growth in Unique Visitors, Visits, and Minutes. That being said, we have seen some sub-categories show growth that is greatly over-indexing. This growth in the Retail category is being driven by these subcategories: Toys, Books, Apparel, Sports/Outdoor, Department Stores/Malls. Toys is leading the charge with a 27% week-over-week growth in Unique Visitors. Analysis from Sports and Real Estate Categories The Sports and Real Estate categories have been two of several categories hit by major decreases in visitation and engagement during the COVID-19 pandemic in Canada. With live sports on hold for most of the major sports leagues in North America – there has been a decline across the board. That being said, during the week of March 23, 2020 to March 29, 2020 for the first time since our COVID-19 analysis began we have seen a decrease in the rate of decline in Visitation, and an in fact an increase in week-over-week Minutes. In terms of the Real Estate category, we have seen small week-over-week decreases with -3% in Unique Visitors, -7% in Visits, and -6% in Minutes – compared to the double-digit declines in the past few weeks. Insights from Other Categories of Interest There were a few other categories that hit our radar this week when looking at the data. These categories have seen week-over-week increases – that show Canadians are increasing Visitation and Engagement with this content. Many of these categories reflect the reality that people are isolated at home – with either kids (whom they must entertain and educate) or without kids or a partner – and they are looking to meet new people (Dating). The Pets category showed big increases, and Lifestyle – Food showed increases in activity. Canadians are apparently focused on love, kids, pets, and their tummies!

Racial and LGBT bias persists in ridesharing drivers despite mitigation efforts
Despite efforts by ridesharing companies to eliminate or reduce discrimination, research from the Indiana University Kelley School of Business finds that racial and LGBT bias persists among drivers. Platforms such as Uber, Lyft and Via responded to drivers' biased behavior by removing information that could indicate a rider's gender and race from initial ride requests. However, researchers still found that biases against underrepresented groups and those who indicate support for the LGBT community continued to exist after drivers accepted a ride request -- when the rider's picture would then be displayed. In other words, their efforts shifted some of the biased behavior until after the ride was confirmed, resulting in higher cancellation rates. Understanding whether bias has been removed also is important for ridesharing companies as they not only compete against each other but also with traditional transportation options. "Our results confirm that bias at the ride request stage has been removed. However, after ride acceptance, racial and LGBT biases are persistent, while we found no evidence of gender biases," said Jorge Mejia, assistant professor of operations and decision technologies. "We show that signaling support for a social cause -- in our case, the lesbian, gay, bisexual and transgender community -- can also impact service provision. Riders who show support for the LGBT community, regardless of race or gender, also experience significantly higher cancelation rates." Mejia and co-author Chris Parker, assistant professor in the information technology and analytics department at American University in Washington, believe they are the first to use support for social causes as a bias-enabling characteristic. Their article, "When Transparency Fails: Bias and Financial Incentives in Ridesharing Platforms," is published in Management Science. They performed a field experiment on a ridesharing platform in fall 2018 in Washington, D.C. They randomly manipulated rider names, using those traditionally perceived to be white or Black, as well as profile pictures to observe drivers' behavior patterns in accepting and canceling rides. To illustrate support for LGBT rights, the authors overlaid a rainbow filter on the rider's picture profile. "We found that underrepresented minorities are more than twice as likely to have a ride canceled than Caucasians; that's about 3 percent versus 8 percent," Mejia said. "There was no evidence of gender bias." Mejia and Parker also varied times of ride requests to study whether peak price periods affected bias. They found that higher prices associated with peak times alleviated some of the bias against riders from the underrepresented group, but not against those who signal support for the LGBT community. They believe that ridesharing companies should use other data-driven solutions to take note of rider characteristics when a driver cancels and penalize the driver for biased behavior. One possible way to punish drivers is to move them down the priority list when they exhibit biased cancellation behavior, so they have fewer ride requests. Alternatively, less-punitive measures may provide "badges" for drivers who exhibit especially low cancellation rates for minority riders. But, ultimately, policymakers may need to intervene, Mejia said. "Investments in reducing bias may not occur organically, as ridesharing platforms are trying to maximize the number of participants in the platform -- they want to attract both riders and drivers," he said. "As a result, it may be necessary for policymakers to mandate what information can be provided to a driver to ensure an unbiased experience, while maintaining the safety of everyone involved, or to create policies that require ridesharing platforms to monitor and remove drivers based on biased behavior. "Careful attention should be paid to these policies both before and after implementation, as unintended consequences are almost sure to follow any simple fix."
