
corporate Experts
Connect for media, speaking, professional opportunities & more.

MEDIA RELEASE: 2026 CAA EV Circuit: EVs go the distance, but charging, efficiency and costs vary
The question for Canadians considering an EV may no longer be how far it can go, but how efficiently it uses energy, how quickly it charges and how much it costs to recharge. Results from the 2026 CAA EV Circuit found significant differences across vehicles in all three areas. “Range anxiety has long dominated the conversation about electric vehicles, but these results suggest the discussion can shift to more personalized considerations for drivers,” says Kaitlynn Furse, director, corporate communications, CAA South Central Ontario. “For many of today’s EVs, the question is becoming less about whether you can complete a trip and more about how efficiently you can make it, where you will charge, how long charging will take, and what it will cost.” All 22 electric vehicles participating in the CAA EV Circuit completed the same 230-kilometre route without needing to charge, including the vehicle with the shortest advertised range. A 15-minute charging test was completed at the end to capture further data. The route started in Blue Mountain, ON and ended in Vaughan, ON. On average, the vehicles used only 40 per cent of their battery charge over the route. EVs demonstrate a significant energy-efficiency advantage over traditional gasoline-powered vehicles The electric vehicles in the Circuit used the energy equivalent of approximately two litres of gasoline per 100 kilometres. By comparison, the average Canadian passenger vehicle consumes roughly eight to 10 litres of gasoline per 100 kilometres. Energy consumption among the participating EVs ranged from 11.43 kilowatt-hours per 100 kilometres to 28.91 kilowatt-hours per 100 kilometres, illustrating the variation among vehicle sizes, weights and designs. A more efficient EV generally requires less electricity to travel the same distance, which can contribute to lower charging costs and less time spent charging. A notable finding was that the vehicles in the September 2026 CAA EV Circuit consumed approximately 40 per cent less energy, on average, than the vehicles evaluated during the February 2025 CAA EV Winter Test. While the tests were conducted under different conditions and with different vehicles, the difference highlights the significant impact that temperature can have on EV efficiency. A short charging stop can meaningfully extend a trip When it comes to charging experience, during the standardized 15-minute charging session, participating vehicles added an average of 110 kilometres of displayed range. Almost two-thirds of the vehicles added at least 100 kilometres, demonstrating that a brief charging stop can provide a meaningful boost during a longer journey. Results differed significantly among vehicles. The displayed driving range added during the 15-minute session varied from 58 kilometres to 178 kilometres. Charging performance can be affected by the vehicle, charger, battery temperature, battery state of charge and conditions at the time of charging. These results also highlight the effect of Canadian climate variations. Vehicles tested in the September 2026 CAA EV Circuit added approximately 15 per cent more displayed range during the charging session than the group evaluated during CAA’s 2025 EV Winter Test. “For Canadians planning longer drives, knowing a vehicle’s total range is only part of the equation,” continues Furse. “Drivers should also understand how their vehicle charges and recognize that the number of kilometres added during a stop can change depending on the vehicle and the charging conditions.” Public fast-charging costs are not the same for every EV The Circuit found that the average cost of a 15-minute charging session at the public fast chargers used in the test was $13.45, but individual vehicle results ranged from $7.28 to $24.39. All vehicles were charged at Tesla charging stations to ensure a consistent charging experience, so it is important to note that Teslas receive preferred pricing at Tesla charging stations. The test was designed to reflect a higher-cost road-trip charging scenario, using premium public fast chargers operating at full capacity. It does not represent the typical cost of powering an EV. CAA’s National EV Driver Survey found that public fast charging accounts for only eight to 18 per cent of charging, meaning most EV drivers generally charge under lower-cost circumstances like at home or work. “Just as Canadians compare fuel economy when buying a gasoline-powered vehicle, they should compare energy efficiency and charging performance when considering an EV,” says Furse. “Where and how often someone expects to charge can make a substantial difference to their experience and road-trip costs.” Complete vehicle findings and additional information about the 2026 CAA EV Circuit are available at 2026 CAA EV Circuit: Complete Vehicle Findings -30- About the CAA EV Circuit The CAA EV Circuit was conducted on September 16, 2026, with 22 electric vehicles travelling the same 230-kilometre route from Blue Mountain to Vaughan, Ontario, across city streets, rural roads and highways. Using a neutral data-driven methodology, all vehicles followed the same route, operated under consistent settings and participated in a standardized charging session. Performance data was collected throughout the drive and validated by CAA’s business intelligence and automotive experts. Data Snapshot Most kilometres gained in a 15-minute charging session Lucid Gravity, 178 km Hyundai IONIQ 5, 136 km Mercedes-Benz CLA with EQ Technology, 135 km Cadillac LYRIQ, 131 km Nissan LEAF, 126 km Least kilometres gained in a 15-minute charging session Lucid Air, 58 km Chevrolet Equinox EV, 71 km Chevrolet Silverado EV, 80 km GMC HUMMER EV SUV, 90 km Tesla Model Y, 97 km Lowest cost per 100 kms of charge added Tesla Model 3, $7.28 Tesla Model Y, $8.23 Nissan LEAF, $10.13 Kia EV4, $10.25 Hyundai IONIQ 5, $10.68 Highest cost per 100 kms of charge added GMC HUMMER EV SUV, $24.39 Chevrolet Silverado EV, $19.05 Rivian R1T, $17.85 Tesla Cybertruck, $15.61 Volkswagen ID. Buzz, $15.48 Lowest energy consumption (kWh/100 km) Toyota bZ 11.43 kWh Tesla Model Y 11.81 kWh Tesla Model 3 11.85 kWh Kia EV4 11.89 kWh Nissan LEAF 12.48 kWh Highest energy consumption (kWh/100 km) Lucid Gravity 28.91 kWh GMC HUMMER EV SUV 23.55 kWh Tesla Cybertruck 23.41 kWh Rivian R1T 19.96 kWh Cadillac LYRIQ 19.1 kWh



Vanderbilt Index Finds Sustainability Remains a Mainstream Consumer Priority
As companies reconsider environmental commitments and sustainability receives less attention in corporate America, American consumers appear to be holding their ground. The inaugural Vanderbilt Consumer Sustainability Index (VCSI), released today by Vanderbilt University and consumer research company Switch 5, finds broad and consistent commitment to sustainability across the country. The national survey of 2,528 American adults found that 83% score above the midpoint on the new index, with surprisingly small differences across regions, gender and urban and rural communities. The findings establish the first baseline for the VCSI, a new quarterly measure designed to track how Americans’ attitudes toward sustainability change over time. Unlike existing measures focused primarily on climate policy or political attitudes, the VCSI looks at Americans as consumers — what they believe, what they expect from businesses and other institutions, and what they say they are willing to do themselves. The inaugural July 2026 reading places the VCSI at 69.2 out of 100, indicating a moderate-to-strong sustainability orientation among American consumers. The VCSI builds on more than two years of consumer research by Switch 5, which studies the attitudes and behaviors shaping consumer adoption of clean energy and sustainable products. That research has included more than 16 national surveys involving more than 50,000 Americans. The partnership with Vanderbilt brings that work into a recurring academic index designed to provide researchers, journalists, and businesses with a consistent measure of how consumer sustainability sentiment is changing over time. “Sustainability is often discussed through the lens of politics or corporate commitments, but consumer preferences are a critical part of the picture,” said Eric VanEpps, Associate Professor of Marketing at Vanderbilt Owen Graduate School of Management and coauthor of the study. “We created the VCSI to establish a consistent measure of what Americans believe and expect when it comes to sustainability, and to track how those attitudes change over time.” Key Findings from the Inaugural Wave 1. Consumer sustainability orientation is stronger than commonly recognized. 83% of Americans score above the midpoint of 50 on the index, suggesting broad popularity of sustainability. “People might read media coverage about how both public and private investments in sustainability initiatives have been reduced, and how large corporations have pulled back from the climate goals they set a few years ago. But the American public still cares about the environment, and these initial results create a baseline from which we can now measure trends in general sentiment,” said VanEpps. 2. Americans want businesses to lead on sustainability. Nearly nine in ten Americans (87%) want companies to help them be more environmentally friendly, and 85% say corporations bear responsibility for addressing climate change. Support for federal government action to address climate change is similarly high, at 84%, indicating broad public expectation that institutions — both public and private — should be part of the solution. “One thing to note is that most Americans work for either large corporations or the government. So when survey respondents say they want these organizations to address climate change, that is also a likely signal of how they want their employers to act,” said Vanderbilt Law School professor and study coauthor Michael Vandenbergh. 3. Concerns about future generations are widespread. More than four in five Americans (81%) believe climate change will harm future generations, including nearly half (47%) who say it will do a great deal of harm. Parents score meaningfully higher on the overall index than non-parents (72.9 vs. 67.3), suggesting the intergenerational frame is a significant motivator of sustainability commitment. 4. Americans say they are willing to act — including at some personal cost. Nearly three-quarters (74%) of Americans say they are willing to pay a little more for products that are better for the environment, and 72% say they are willing to sacrifice convenience to make environmentally friendly choices. These findings suggest meaningful room for consumer-facing sustainability initiatives that go beyond attitude measurement into behavioral change. 5. Sustainability commitment cuts across demographic lines. Perhaps the most noteworthy finding of the inaugural wave is how narrow the differences are across groups typically assumed to hold divergent views on the environment. Regional differences are minimal, with less than 2 points separating the highest and lowest of the four census regions. The gender gap is 1.5 points, and the urban-rural gap is 3 points. 6. Younger Americans lead, but sustainability commitment is broad across generations. Americans aged 18-34 score 72.2 on the index, compared to 65.1 among those 65 and older — a 7-point generational gap that reflects growing sustainability orientation among younger cohorts. Even the oldest segment sits well above the midpoint of the scale, however, indicating sustainability commitment has broad support across generations. Methodology The inaugural wave of the VCSI was fielded to a nationally representative sample of 2,528 American adults in July 2026, with data collection and analysis conducted by Switch 5 using PureSpectrum and Beacon Research. The 10-item composite index demonstrates strong internal reliability (Cronbach’s α = 0.87). Two sub-indices — Consumer Commitment (5 items) and Climate Concern & Responsibility (5 items) — correlate at r = 0.52, indicating that the two dimensions are meaningfully related but distinct. Full methodology and item-level results are available upon request, with a website currently in development. The next wave of the VCSI is expected to be fielded in October 2026 and released in late fall. Subsequent waves will report the current index level along with wave-over-wave and year-over-year changes.




Pride Month: From Protest to Global Celebration
Pride Month is celebrated each June to honour the 1969 Stonewall Uprising in New York City, when LGBTQ+ patrons resisted a police raid at the Stonewall Inn. The uprising lasted several days and became a defining moment in the modern LGBTQ+ rights movement. One year later, the first Pride marches were held, transforming public protest into an annual call for visibility, dignity, safety, and equality. Today, Pride is marked around the world in many different ways. In Canada, the United States, and much of Europe, celebrations often include parades, festivals, concerts, flag-raisings, community events, and public education campaigns. In places such as Brazil, Mexico, South Africa, Japan, India, and Australia, Pride can blend celebration with activism, reflecting local histories, cultures, and legal realities. In countries where LGBTQ+ rights remain restricted or unsafe, Pride may take the form of smaller gatherings, private events, online campaigns, or human-rights advocacy rather than large public parades. What makes Pride powerful is that it is both celebration and protest. It recognizes progress, honours those who fought for change, and draws attention to the discrimination, violence, and legal barriers still faced by LGBTQ+ people in many parts of the world. For journalists, Pride Month offers a timely opportunity to explore history, human rights, culture, public policy, youth identity, corporate participation, faith communities, education, health, and the changing meaning of inclusion across borders. Connect with experts who can speak to the history of Pride, LGBTQ+ rights, identity, culture, and how communities around the world continue to mark this important month. Discover all of our experts here: www.expertfile.com


Survey says: Senior leaders are using AI, but they could use more direction
Over the years, study upon study has shown that senior leaders are slower to adapt to new technology – email, the Internet and social media – than younger employees. That’s not necessarily so with AI, according to the University of Delaware’s Saleem Mistry. Mistry, associate professor of management at UD's Alfred Lerner College of Business & Economics, recently conducted a survey of more than 200 university alumni, 75% of which had more than 16 years of professional experience. He found that senior leaders are actively adopting AI to solve their biggest challenges. However, they are doing so largely without structured support or guidance. Here are four findings from Mistry's survey that shows how AI is actually being used at the top. Senior Leaders Are Overwhelmingly Self-Taught Mistry said his most glaring finding is the gap between high AI adoption among senior leaders and the near-total absence of formal corporate support. Although a majority use these tools, they are almost entirely self-taught, which highlights visible opportunity that organizations aren’t really steering the AI conversation for leaders: • High usage. 62% of all senior leaders surveyed use AI tools "regularly" or "occasionally" in their work. • Training gap. Of those users, an overwhelming 80% report their organization provides "Never" or only "Sometimes" (mostly never) adequate training. Mistry said this shows that leaders from VP level down are using tools like ChatGPT and Copilot informally to keep up with heavy workloads, without any real organizational guidance. The stakes are high. In the survey, a vice president of legal was using AI for compliance tasks and a manager of three was using it for performance reviews, both with no formal training. “These are senior leaders handling sensitive work while essentially figuring it out on their own,” Mistry said. There is a clear ladder of AI use Leaders are not using AI randomly. There is a clear progression in how they use it, moving through three levels. • Tier 1 (The Drafters) This is the most common starting point. Leaders use AI to improve writing and communication. They draft emails, shape documents, and refine tone. As one Director of Product put it, it helps him "polish phrasing" and adjust tone and voice. • Tier 2 (The Synthesizers) At this stage, leaders use AI to manage information overload. They summarize meetings, condense documents, and pull together research so they can keep up with large volumes of input. As one leader managing a team of 200 said, "Being a leader requires attention in a variety of areas. AI helps me manage the vast amounts of information I need to consume." • Tier 3 (The Architects) Here, leaders move beyond writing and summarizing. They use AI to automate parts of their work. This includes building agents, creating custom GPTs, or designing tools that track work and performance. One leader managing 300 people said, "It will eliminate half or more of my overhead." Managers and individual contributors use AI for different reasons People managers and individual contributors (IC) are using AI for very different reasons based on their roles. • For people managers, their main challenge is scale. They are overloaded with communication and administration, so they use AI to reduce noise and keep up. They lean heavily on summarization and tone adjustment tools. • For project leads and ICs, their focus is output. They use AI to produce work faster, including drafting content, building decks, writing code, or generating ideas. This difference reflects their jobs. One group is trying to keep up, the other is trying to produce more. It also shows that AI is not a single-use tool. Its value depends on the problem it is being used to solve. This difference reflects their jobs. One group is trying to keep up, the other is trying to produce more. It also shows that AI is not a single-use tool. Its value depends on the problem it is being used to solve. Resistance to AI is mostly intentional Among the 38 percent of leaders who do not use AI, resistance is usually not based on lack of awareness. It falls into three groups: • The Ethical Objectors. Some avoid AI due to concerns about its broader impact. • The Quality Skeptics. Some do not trust the output and feel it is not reliable enough for important work. • The Blocked. Some are not allowed to use AI due to company policy. Mistry concludes that there is a clear overall pattern: Leaders are using AI in practical ways, but mostly without structured support or guidance. “If it feels like you are figuring this out as you go without much help from your organization, that is consistent with what most leaders are experiencing,” Mistry said. To connect directly with Mistry and arrange an interview, visit his profile page and click on the "connect" button. Interested reporters can also email MediaRelations@udel.edu.



Target Can’t Seem to Escape the Crosshairs
The on-again-off-again nationwide boycott of Target has the retailer’s new chief executive, Michael Fiddelke, officer facing relentless pressure from activists on both sides of the issue. David Primo, a professor of political science and business administration at the University of Rochester, says Fiddelke can’t seem to move Target from the crosshairs despite slashing prices on thousands of products and investing in stores, workers, and technology. “Target remains a battleground for activists on the left and the right, and its new CEO hasn’t yet figured out how to extricate the company from this role,” Primo recently told USA Today. “Fiddelke already faces a huge challenge in turning around a company with significant operational issues. This certainly doesn’t help matters.” Target has reported 13 straight quarters of sluggish sales. Company officials have admitted that shopper anger has contributed. Activists in Minneapolis, where Target is based, organized a nationwide boycott last year over the company’s rollback of diversity, equity, and inclusion policies. From church pulpits to community gatherings, the policy about-face was widely viewed as a betrayal of Black Americans who had propped up the retail giant’s bottom line. Primo studies corporate political strategies, among other areas, and regularly shares his insights with business journalists and political reporters. His essays have appeared in The New York Times and The Wall Street Journal, and he’s been interviewed by many radio and television outlets, including Bloomberg and National Public Radio. Contact him by clicking on his profile.



Workplace jargon hurts employee morale, collaboration, study finds
You’ve probably heard it before in a meeting: “Let’s touch base offline to align our bandwidth on this workflow.” Corporate jargon like this is easy to laugh at — but its negative impact in the office can be serious. According to a new study, using too much jargon in the workplace can hurt employees’ ability to process messages, leading them to experience negative feelings and making them feel less confident. In turn, they’re less likely to reach out and ask for or share information with their colleagues. “You need people to be willing to collaborate, share ideas and look for more information if they don't understand something at work,” said Olivia Bullock, Ph.D., an assistant professor of advertising at the University of Florida and co-author of the new study. “And jargon might actually be impeding that information flow across teams.” Age made a difference, though. Older workers had a harder time processing jargon, but were more likely to intend to ask for more information to clarify the message. Younger employees were less likely to seek and share information when confused by jargon. “It gives credence to the idea that younger people are more vulnerable to these workplace dynamics,” Bullock said. “If you're onboarding younger employees, explain everything clearly.” Bullock and her co-author, Tiffany Bisbey, Ph.D., an assistant professor at George Washington University, published their findings Aug. 25 in the International Journal of Business Communication. An expert in communication research, Bullock has long studied jargon’s negative effects for talking about health and science. Then, faced with jargon in her own work, she started to ask how these arcane, technical words might get in the way of a smooth workplace. To find out, Bullock surveyed nearly 2,000 people who were told to imagine they had just started a new job and received an email with important directions. Half had to navigate a jargon-filled message about “intranets” and “EFT” payments. The other half had that jargon translated back into plainer language. The message packed with jargon, not surprisingly, made it harder for people to process the information, which can throw off an entire workday. “It doesn't just make them feel bad about the information they've been given. It makes them feel bad about themselves,” Bullock said. The study then asked people how they would respond to the jargon. The impenetrable language made them feel insecure and less likely to ask for help right when they needed it the most. “They weren’t as willing to collaborate,” Bullock said. “If you can’t ask for more information or share that information downstream, you’re creating silos, and that’s disrupting your workflow and environment.” Having studied jargon for so long, Bullock has one piece of advice for employers and employees alike. “Always reduce jargon,” she said. “The benefit of using jargon doesn’t outweigh the cost.”



AI gives rise to the cut and paste employee
Although AI tools can improve productivity, recent studies show that they too often intensify workloads instead of reducing them, in many cases even leading to cognitive overload and burnout. The University of Delaware's Saleem Mistry says this is creating employees who work harder, not smarter. Mistry, an associate professor of management in UD's Lerner College of Business & Economics, says his research confirms findings found in this Feb. 9, 2026 article in the Harvard Business Review. Driven by the misconception that AI is an accurate search engine rather than a predictive text tool, these "cut and paste" employees are using the applications to pump out deliverables in seconds just to keep up with increasing workloads. Mistry notes that this prioritization of speed over accuracy is happening at every level of the organization: • Junior staff: Blast out polished looking but unverified drafts. • Managers: Outsource their ability to deeply learn and critically think in order to summarize data, letting their analytical skills atrophy. • Power users: Build hidden, unapproved systems that bypass company oversight. A management problem, not a tech problem "When discussing this issue, I often hear leaders blame the technology. However, I believe that blaming the tech is missing the point; I see it as a failure of leadership," Mistry said. "When already overburdened employees who are constantly having to do more with less are handed vague mandates to just use AI without any training, they use it to look busy and produce volume-based work. Because many companies still reward the volume of work produced rather than the actual impact, employees naturally use these tools to generate slick but empty deliverables." "I believe that blaming the tech is missing the point; I see it as a failure of leadership. Because many companies still reward the volume of work produced rather than the actual impact, employees naturally use these tools to generate slick but empty deliverables." The real costs to organizations and incoming employees Mistry outlines three risks organizations face if they don’t intervene: 1. The workslop epidemic "These programs allow people to generate massive amounts of workslop, which is low-effort fluff that looks good but lacks substance. It takes seconds to create, but hours for someone else to decipher, fact-check, and fix," Mistry notes. "This drains money (up to $9 million annually for large companies) and destroys morale. As an educator, researcher, and a person brought into organizations to help fix problems, I for one do not want to be on the receiving end of a thoughtless, automated data dump, especially on tasks that require real skill and deep thinking." 2. Legal disaster He also states, "When the cut and paste mentality makes its way into professional submissions, the risks to the organization are real and oftentimes catastrophic. Courts have made it perfectly clear: ignorance is no excuse. If your name is on the document, you own the liability. Recently, attorneys have faced severe sanctions, hefty fines, and case dismissals for blindly submitting fake legal citations made up by computers." Click here for a list of cases. 3. A warning for incoming talent For new graduates entering this environment, Mistry offers a warning: Do not rely on AI to do your deep thinking. "If you simply use AI to blast out polished but unverified drafts, you become a replaceable 'cut and paste' employee," he says. “To truly stand out, new grads must prove they have the discernment to review, tweak, and challenge what the computer writes. The hiring edge is no longer just saying, 'I can do this task,' but 'I know how to leverage and correct AI to help me perform it.'" Four ideas to fix it To survive and indeed thrive with these new tools and avoid the unintended consequences of untrained staff, organizations should: 1. Reinforce the importance of fact-checking and editing: Adopt frameworks that teach employees how to show their work and log how they verified computer-generated facts. 2. Change the incentives: Stop rewarding busy work, useless reports, and massive slide decks. Evaluate employees on accuracy and results. 3. Eradicate superficial work: Don’t use automation to speed up ineffective legacy processes. Instead, use it to identify and eliminate them entirely. 4. Make time for editing: Give yourself and your employees the breathing room to actually review, tweak, and challenge what the computer writes instead of accepting the first draft. Mistry is available to discuss: Why AI is causing an epidemic of corporate "workslop" (and how to spot it). The leadership failure behind the "cut and paste" employee. How to rewrite corporate incentives to measure impact instead of volume in the AI era. Strategies for implementing safe, effective AI policies at work. How new college graduates can avoid the "workslop" trap in their first jobs. To reach Mistry directly and arrange an interview, visit his profile and click on the "contact" button. Interested reporters can also send an email to MediaRelations@udel.edu.

Canadians remain passionate about exploring new destinations, but changing global dynamics are reshaping how and where they travel. According to CAA’s Travel Wise survey, more than half of Canadians (51 per cent) now say geopolitical and economic factors, such as instability abroad, a perception of the U.S. as being less welcoming, and rising travel costs, are influencing where Canadians choose to travel. Shifting Destinations and Attitudes Travel patterns are evolving. The survey conducted in 2025 shows that only 22 per cent of Canadians planned to visit the U.S., an 11 per cent drop from 2024. Instead, many are opting to stay within Canada (40 per cent) or explore international destinations. The perception of the U.S. as less welcoming, coupled with rising travel costs and global instability, is prompting Canadians to reconsider their travel plans. "Canadians are adventurous by nature, but today’s travellers are having to make thoughtful decisions," says Kaitlynn Furse, Director of Corporate Communications. "We’re seeing a clear trend toward exploring closer to home and seeking out new international experiences, all while keeping an eye on safety and value." Travel Insurance: A Critical, Yet Overlooked, Safeguard While Canadians feel confident travelling within their own country, many assume “home turf” means low risk. This misconception leaves millions exposed to unexpected costs when trips don’t go as planned. The survey found that 64 per cent did not have travel insurance on their most recent trip when travelling within Canada. “Recent stories have highlighted Canadians facing unexpected medical bills, trip interruptions, and emergency expenses while travelling within Canada, often because they didn’t realize their regular provincial health coverage or credit card benefits had limits,” says Furse. “If something were to happen, provincial healthcare only partially covers you outside of your home, and sometimes, not at all, covering only basic emergency medical services when travelling in another province.” Among those who travelled uninsured, 44 per cent believed coverage wasn’t needed, and 29 per cent thought their provincial government’s health plan would suffice. However, provincial healthcare only partially covers emergency medical services in other provinces, and sometimes not at all. “One of the biggest misconceptions we see is the idea that travelling within Canada comes with less risk,” says Furse. “Unexpected medical costs, trip interruptions and emergencies can happen anywhere, and many travellers are surprised to learn they’re not fully covered.” With recent geopolitical incidents in Cuba, Mexico and the Middle East, Travel Wise is focused on helping Canadians understand risk, avoid misinformation, and make decisions grounded in facts rather than fear or speculation. Here are some tips: Understand what an “avoid non-essential travel” advisory really means: Travel advisories reflect real-time safety risks, and an “avoid non-essential travel” signal indicates rapidly changing conditions that may change quickly, and support may be limited. Know that advisories can affect your insurance and your exit options: Travelling against government advice can limit your travel insurance, including medical care or emergency evacuation. Coverage must be in place before conditions deteriorate. Flexibility is essential; review cancellation and change policies now: Travellers should proactively confirm cancellation deadlines, refund eligibility, rebooking options for all reservations and understand the limits of credit card protections, employee benefits, and pension coverage benefits. Stay connected to Canada while abroad: Canadians should monitor official updates from Global Affairs Canada and register with the Registration of Canadians Abroad service before departure or while on location if something arises. Rely on reputable sources and be cautious of misinformation online: Canadians should rely on official government sources, established travel organizations, and verified news outlets for travel guidance. For many travellers, cancelled or delayed flights remain a top concern. CAA’s Air Passenger Help Guide offers a straightforward resource for travellers facing disruptions. The online survey was conducted by DIG Insights from September 29 – October 8, 2025, with 2,0210 Canadian travellers aged 25 to 64 who have travelled outside their province of residence in the past three years and plan to travel again in the next five years. Based on the sample size of n=2,021 and with a confidence level of 95%, the margin of error for this research is +/- 2%.)

Expert Insights: Environmental Risk in Times of Regulatory Change & Litigation Pressure
Environmental risks are becoming a central concern for organizations as regulations tighten, public expectations rise, and litigation related to environmental claims grows more common. Companies today must navigate a complex landscape where regulators, investors, and advocacy groups are paying closer attention to how environmental impacts are managed and reported. Recently, J.S. Held published the article, Environmental Claims and Disputes: Navigating Regulatory Change and Litigation Pressure, led by environmental risk and compliance expert Kimberly Logue Ortega. In this article, experts from J.S. Held share practical insights for insurance professionals and legal advisors on identifying environmental risks across industries and preparing for environmental disputes before they escalate. It examines how this increased scrutiny is creating new legal and financial pressures, particularly when organizations fail to comply with evolving regulations or when environmental claims made in public disclosures are challenged. A key issue is the growing focus on corporate environmental statements and sustainability reporting. Businesses face potential consequences whether they overstate environmental achievements, commonly referred to as “greenwashing" or avoid discussing them altogether. Without strong governance systems, clear internal oversight, and transparent reporting processes, organizations may expose themselves to regulatory penalties, legal disputes, and reputational damage. The article emphasizes that effective environmental governance is no longer simply a compliance exercise but an essential part of responsible corporate management. Kimberly Logue Ortega specializes in environmental risk and compliance. With over fifteen years of experience in the areas of environmental and natural resources law, Ms. Logue provides consulting and expert services for industrial facilities and law firms throughout the country. She has extensive experience with assessing and managing potential and ongoing compliance obligations. She routinely supports clients and media on rulemaking and legislative efforts focused on environmental and natural resources issues. View her profile As environmental regulations and stakeholder expectations continue to evolve, organizations that proactively strengthen their compliance frameworks and reporting practices will be better positioned to manage risk and build trust. The full report offers deeper insights into how companies can navigate regulatory change, reduce exposure to environmental claims, and develop stronger governance strategies in an increasingly complex landscape. To explore the topic further, simply connect with Kimberly through her icon below.


Ocean Tomo Releases 2025 Intangible Asset Market Value Study Results
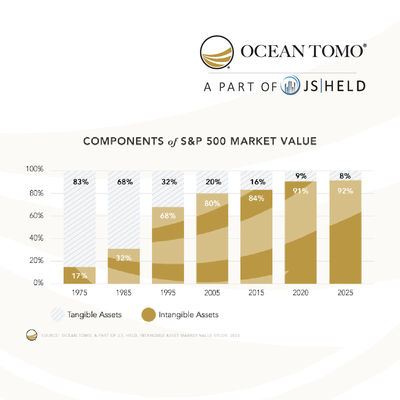
Global consulting firm J.S. Held announces the release of the Ocean Tomo Intangible Asset Market Value (IAMV) study. With this release, the study now reflects a panel of 50 years of data in the US market and 20 years of data in foreign markets. The study examines the components of market value, specifically the role of intangible assets, across a range of global indexes. IAMV is shown as of calendar year end by subtracting net tangible asset value from market capitalization. Commenting on the Components of S&P 500® Market Value, economic expert and study author Matthew Johnson observes, “the composition of corporate value has undergone a fundamental transformation over the past five decades.” In 1975, tangible assets—property, plant, equipment, inventory, and other physical capital—represented 83% of the market value of companies comprising the S&P 500 index, with intangible assets accounting for only 17%. By the end of 2025, this relationship had completely inverted: intangible assets now constitute approximately 92% of S&P 500 market capitalization, while tangible assets have been reduced to a mere 8%. Johnson adds, “This 75 percentage point shift represents what Ocean Tomo has defined as ‘economic inversion’— a wholesale transformation in the nature of value creation whereby economic worth has migrated from what can be ‘touched’ to what can be ‘thought’." The magnitude and implications of this transformation are comparable to the Industrial Revolution of the 18th and 19th centuries. Just as the Industrial Revolution fundamentally restructured economic activity from agrarian and craft-based production to mechanized manufacturing, the intangible revolution has redefined the sources and measurement of corporate value in the 21st century. Ocean Tomo Co-founder and J.S. Held Chief Intellectual Property Officer, James E. Malackowski observes, “While the Industrial Revolution required a century to unfold fully, the intangible revolution has occurred within a single human lifespan, with particularly rapid acceleration occurring in the 1985-2005 period when intangible asset market value increased from 32% to 79%—a remarkable 47 percentage point surge in just two decades.” The 2020-2025 period deserves special attention: S&P 500 IAMV remained stable at approximately 90% despite the Federal Reserve implementing the most aggressive monetary tightening cycle in four decades. Dr. Nikki Tavasoli, PhD, shares, “Traditional financial theory predicts that intangible-intensive firms should be highly sensitive to interest rate changes due to their long-duration cash flows and limited collateral value.” She adds, “The observed stability challenges this prediction and requires explanation, which we address in a forthcoming paper.” In 2005, the IAMV study was expanded beyond the S&P 500 to explore the components of value in several key international markets. Stock market indexes from Europe, China, Japan, and South Korea were selected and analyzed to determine the comparable role of intangible assets. To learn more about the 2025 Intangible Asset Market Value Study, please visit: Media Contact Kristi L. Stathis, J.S. Held 1 786 833 4864 Kristi.Stathis@JSHeld.com JSHeld.com
