Experts Matter. Find Yours.
Connect for media, speaking, professional opportunities & more.

Why Japan Issued a "Megaquake" Advisory Following Last Week's Tremor
The magnitude 7.1 earthquake that struck Japan's southern islands on August 8 left some residents of the country in panic. Not from the tremor itself, which caused only a handful of minor injuries and quick-expiring tsunami alerts, but rather the unprecedented advisory from the Japanese Meteorological Agency warning of an elevated risk of a "megaquake" in the region over the coming weeks. A "megaquake," short for a megathrust earthquake, is a type of temblor that occurs at a subduction zone, where one tectonic plate slips under another. A release of the tension that forms the thrust fault where the two plates meet can trigger some of the strongest earthquakes on the planet, measuring 9.0 or higher on the Richter scale, and produce large tsunamis. It may sound a bit alarmist, but Isabel Hong, PhD, assistant professor in Villanova University's Department of Geography and the Environment, assures that "even though it is not possible to predict earthquakes, the advisory comes from a place of prior knowledge." "We can't say for certain [when these earthquakes will happen]," she reiterated. "But probability suggests it could be more likely, in part because this smaller earthquake event occurred." The acute event—last week's earthquake—is indeed the root of the alert, which was issued in the following hours. The quake's epicenter was located close to the end of the Nankai Trough, a subduction zone off the coast of Japan where the Philippine Sea Plate slips under the Eurasian Plate. The Nankai Trough has historically produced strong earthquakes, most recently an 8.0 tremor in 1946. "Oftentimes, a large earthquake event can then trigger subsequent earthquakes," Dr. Hong said. "It can transfer stress to other faults that can make it more conducive for other earthquakes to then rupture, and that's the general belief of what's happening with the Nankai Trough right now." To compound the acute disturbance last week, Japanese government officials had already previously warned of a 70-80 percent likelihood of a Nankai Trough earthquake measuring 8-9 on the scale within the next 30 years. That warning was the product of extensive research into the region's seismic history. "All of the data that goes into [an advisory like that] is pulled from the work of dedicated scientists looking at past earthquake and tsunami deposits," said Dr. Hong, who herself studies prehistoric geohazards by analyzing their geologic trails along coasts. "This allows us to refine our understanding of the frequency of such events in a region. In this case, scientists can say, 'These happen about every 100 years, and it's already been over 70. Therefore, there's a higher probability another will occur in the next 30.'" If it does, officials fear that a strong earthquake could trigger a massive tsunami that would reach the coast of Japan within minutes due to its proximity, threatening the lives of hundreds of thousands of individuals. "Tsunamis occur along active subduction zones like the Nankai Trough," Dr. Hong said. "They do have to be generated by a strong earthquake, yes, but more important in their impact to coastal communities is the shape of the coastline offshore. If they go from deep to shallow water very fast, the tsunami builds tall." So, whether it appears alarmist or not, having the ability to study these seismic events in a way that can warn individuals of heightened risks should not be taken for granted, says Dr. Hong. Early warning signs and advisories for potential geohazards can save lives. "One of the reasons we dig into the geologic past is to help inform people what could happen in the future."


For the fifth consecutive year, ChristianaCare’s Center for Heart & Vascular Health has earned the premier recognition from The American College of Cardiology (ACC) – the HeartCARE Center National Distinction of Excellence award – for its commitment to comprehensive, high quality cardiovascular care. ChristianaCare was the first hospital system in Delaware and one of only a handful in the U.S. to attain this recognition when it was first awarded in 2020 from the ACC, a nonprofit medical association representing more than 50,000 cardiovascular specialists. “We are proud to be a regional leader for cardiovascular care with the most advanced medical, surgical and minimally invasive specialty care, technology and research,” said Kirk Garratt, M.D., medical director of ChristianaCare’s Center for Heart & Vascular Health. “Congratulations to our entire team and all who collaborate seamlessly to deliver care 24/7. As a result, those living in Delaware and neighboring states can receive the highest quality cardiovascular care from the Center for Heart & Vascular Health.” Hospitals that have earned an ACC HeartCARE Center designation have met a set of criteria, including participating in at least two ACC accreditation services programs, national cardiovascular data registries and targeted quality improvement campaigns designed to close gaps in guideline-based care. In addition to being a current recipient of the HeartCARE Center designation, ChristianaCare participates in the ACC’s chest pain MI with PCI (heart attack with angioplasty) and resuscitation accreditation, cath lab accreditation and the Society of Thoracic Surgeon database. “ChristianaCare has demonstrated its commitment to providing the community with excellent heart care,” said Deepak L. Bhatt, M.D., MPH, FACC, chair of the ACC accreditation management board. “ACC accreditation services is proud to award the Center for Heart & Vascular Health with the HeartCARE Center designation.” Hospitals receiving the HeartCARE Center designation have demonstrated their commitment to consistent, high-quality cardiovascular care through comprehensive process improvement, disease and procedure-specific accreditation, professional excellence and community engagement. ChristianaCare has proven to be a forward-thinking institution with goals to advance the cause of sustainable quality improvement. The Center for Heart & Vascular Health is among the largest, most capable regional heart centers on the East Coast. It is among the few centers in the region that integrates cardiac surgery, vascular surgery, vascular interventional radiology, cardiology and interventional nephrology in a single location. Its expert clinical staff performed nearly 200,000 patient procedures last year.


Expert Insight: NFL Fandom: The Last Cultural Unifier?
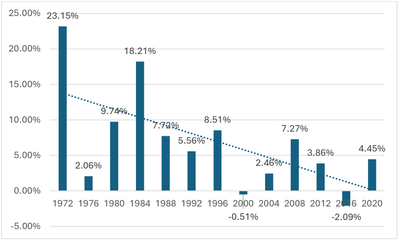
In 2024, few cultural touchstones unify America. One of the remaining cultural unifiers is the NFL. It is almost guaranteed that the Super Bowl will be the most watched television program each year. Add Taylor Swift (another rare cultural unifier) attending to watch her boyfriend and an appealing halftime musical guest, and you can have over 120 million people watching the same program at the same time. Nothing else comes close. There is little doubt that the NFL is the undisputed champion of American sports. But how do the various NFL fandoms compare? Which team has the top fandom, and which struggles (struggle is relative here, as the lowest-ranked NFL fandom is still impressive)? This is an interesting question in a couple of ways. First, it reveals something important about the level of connection in different cities. Cities with stronger fan bases tend to have more of a shared identity. Boston residents share more love across their teams (Celtics, Red Sox, Bruins, Patriots) than folks from Tampa Bay. “Sports” cities are fundamentally different. It's also an interesting marketing analysis. Fandoms are people who share passion and love for what are essentially brands. Examining fandom can reveal something critical about how brands that inspire fandom are built. Comparing fan bases can also inflame passions. Sports fans are (often) the ultimate fans as they closely identify with their teams and feel each victory as a personal triumph and each loss as a defeat. Because fans’ identities are tied to their teams, ranking fan bases can feel like an attack. Saying Browns fans aren’t as good of fans as Ravens fans feels like an attack on Cleveland. The deeper perspective motivating this analysis is that fandom is about cultural passion, so what people are fans of largely dictates the tone and content of our societies. A society that loves baseball, country music, and trucks feels very different from one that favors soccer, opera, and Vespas. The fandom rankings are a snapshot in time of how fandom works in the NFL. And remember, the NFL is not just the top sports league in America but also the closest thing we have in 2024 to a shared societal passion. Analyzing Fandoms I have been ranking NFL and other fan bases for more than a decade. These fandom analyses are an example of brand equity analytics, and they use two types of data. The goal is to understand the relationship between market characteristics and fandom outcomes at the league level. We can then evaluate each team based on how it performs relative to league norms. The fandom or market outcome measures include things like data on prices, attendance, and social media following. These are measures of fan engagement. Prices provide a signal of how much market power a team has created. Attendance shows the enthusiasm of fans in the market to pay for tickets and take the time to travel and attend. Social media following reveals how many fans the team has in and out of their home market. Each metric has advantages and limitations. Social media following provides an indication of national fandom, but it also captures casual fans who would never pay for a ticket. The second aspect of the analysis focuses on market potential. NFL markets vary from New York, with a population of 20 million, to Green Bay, with a few hundred thousand. Income levels in San Francisco are far higher than in Jacksonville or Cleveland. I use a range of demographics, but income and population are the major factors. Again, the metrics are good but not perfect. For example, using MSA populations isn’t perfect because teams have different footprints. The Packers are more of a Wisconsin team than a Green Bay team. The teams in New York and LA share a market. Should they each get half of the metro area population? One factor that I do not control for is competition. In the southeast, NFL teams may compete with SEC teams. I have debated this issue (with myself) and have decided to neglect it. This year's analysis includes a significant change from last year. The significant change is that I am not controlling for team performance. Controlling for team performance is helpful because it isolates core or unchanging fandom. This approach has appeal, as we can argue that teams with more passionate fandoms will be more resilient against losing seasons. The downside of controlling for performance is that we get less of a measurement of the fandom's overall value. If a team like Kansas City is on an extended winning streak, then the Chiefs brand is very valuable at the moment. Controlling for winning makes the analysis more about the core, near-permanent passion of a fandom, while not controlling makes the results more relevant to current brand power. The analysis involves three steps. The first step creates measures of each team’s relative fandom outcomes and market potential. The second step develops a statistical model of the relationship between market potential and fandom outcomes. The third step compares each team's fandom outcomes with the statistical model's predictions. The third step is a comparison of actual results versus predicted – the key point is that the prediction is based on leaguewide data. As these analyses are always imperfect, the best way to consider the fandom rankings is as tiers. I like the idea of quadrants. Some brief comments on the members of each quadrant (Elite, Solid, Role Players, Benchwarmers). I will be discussing each fandom on social media. TikTok: @fanalyticspodcast Instagram: @fanalyticsmikelewis YouTube: @fanalyticsmike A bonus figure follow the Quad overviews. The Results Quadrant 1: The Elite The Dallas Cowboys lead the top group of teams, followed by the Packers, Eagles, Chiefs, 49ers, Raiders, Patriots, and Steelers. Sounds a lot like what the man on the street would list as the top NFL brands. The Cowboys and Packers leading the way is no surprise. The Cowboys are second in social following and the leaders in attendance. The Packers are an astonishing fandom story as the team is located in the definitive small market. The Eagles leading the Steelers is going to be troubling in Western Pennsylvania, but the Eagles have more pricing power and more social following. The 49ers are a solid NFL fandom with few weaknesses. The Patriots are in a new era, and it will be fascinating to see if they maintain their top-tier position as Brady and Belichick become memories. The Chiefs' presence in the top group is a change from past years and is due to the shift away from controlling for performance. The Chiefs have a great fandom, but the team’s success currently pumps them up. The Chiefs are in a brand-building phase as the team continues building its dynasty. The question for the Chiefs is where they end up long-term. I don't fully understand the Raiders' ranking. The Raiders are midrange in attendance and social following but do well because are reported to have the highest prices in the league. I suspect this is more an idiosyncrasy of the Las Vegas market than a reflection of significant passionate fandom. Quadrant 2: Solid Performers The Quadrant 2 teams are the Broncos, Giants, Panthers, Seahawks, Saints, Ravens, Texans, and Browns. These are the solid performers of NFL fandoms (brands). These are teams with above expected fandom outcomes for their relative market potentials. The Quadrant 2 clubs are all passionate fanbases (maybe one exception) despite very different histories. For example, the AFC North rival Ravens and Browns differ in both relative history and frequency of winning. Cleveland fandom involves significant character, while the Ravens are a “blue-collar” brand that has been a consistent winner. There are a lot of great stories in Quad 2. The Saints were once the Aints but are now a core part of New Orleans. The Broncos and Giants are great fandoms who are probably angry to be left out of Quad 1. The Panthers' position is unexpected and may be due to some inflated social media numbers. This is the challenge when an analysis is based only on data. When data gets a little weird, like an inflated social media follower count dating back to Cam Newton's days, the results can also get a little weird. This is a teachable moment—do not analyze and interpret data without knowing the context (the data-generating processes). Quadrant 3: Role Players Quadrant 3 fandoms are teams whose fandom outcomes are slightly below average league performance (for similar markets). The Quadrant 3 teams include (in order) the Bills, Falcons, Buccaneers, Jets, Vikings, Bears, Dolphins, and Bengals. There are some interesting teams in Quad 3. The Bills have a great and notorious fandom. Jumping through flaming tables in subzero weather should get you into the top half of the rankings? The big-market Jets and the small-market Bengals have two of the most fascinating QBs in the league. Both clubs could be poised to get to Quad 2 with a Super Bowl or two. Da’Bears may be one of the most disappointing results. A team with an SNL skit devoted to their fandom in a market like Chicago shouldn’t be in Quad 3. Other quick comments: The Falcons need to win a title. Florida is tough for professional teams. The Vikings should play outside. Quadrant 4: Hopium These are the NFL's weakest fandoms, with the key phrase being “the NFL’s.” The Quad 4 teams, in order, are the Lions, Rams, Jaguars, Colts, Titans, Commanders, Chargers, and Cardinals. It’s a lot of teams who have not won regularly and have many moves and name changes. The Lions are poised for a move upward and maybe a sleeping giant of a fandom. They have the most watchable coach in the league and the most surprising celebrity fan. An interesting side story in Quad 4 is the battle for Los Angeles between the Rams (formerly of Saint Louis) and the Chargers (previously San Diego). They play in the same market, but the Rams have won more. But will Herbert lead the Chargers past the Rams? Quad 4 illustrates an important lesson: consistency. The Rams moved from St. Louis and then back to LA. The Chargers went from San Diego to LA. The Colts left Baltimore in the middle of the night. The Titans were the Oilers and moved from Houston to Nashville. The Cardinals were the other NFL team Saint Louis lost. The Commanders should have stopped with their previous name. The Fandom Outcomes / Market Potential Matrix The following figure is a bit of bonus material that may provide some insight into the inner workings of the analysis. The figure below shows the performance of each team on the Fandom Outcome and the Market Potential Indexes. The upper left region features teams with less lucrative markets but above-average fandoms, like the Packers, Steelers, and Chiefs. The lower right region is the teams with below-average fandom outcomes despite high potential markets, like the Commanders, Chargers, and Rams. This pictorial representation is also interesting as it shows teams with similar positions. These similarities can be somewhat surprising. For example, the Lions and Dolphins have very similar profiles despite the differences between Detroit and Miami. Mike Lewis is an expert in the areas of analytics and marketing. This approach makes Professor Lewis a unique expert on fandom as his work addresses the complete process from success on the field to success at the box office and the campaign trail. Michael is available to speak with media - simply click on his icon now to arrange an interview today. Interested in following Future Fandom! Subscribe for free to receive new posts.


Teacher mindfulness doesn't begin on the first day of classes in the late summer or early fall. It is an invaluable skill that can be practiced and perfected all throughout the year, especially when teachers are on summer break. Leigh McLean is an an associate research professor in the School of Education and Center for Research in Educational and Social Policy at the University of Delaware. In her program of research, she investigates how teachers’ emotions and emotion-related experiences including well-being impact their effectiveness. Her work particularly focuses on how teachers’ emotions impact their instructional practices, and the role that early-career teachers’ emotions play as they transition into the career. She holds expertise in quantitative, mixed-methods, and longitudinal study design and implementation, multileveled data analysis, and classroom observation. Below she gives a few tips on how teachers can begin preparing themselves – and by extension their future students – for all the ups and downs of the upcoming school year. Engage in restorative rest this summer. One of the ways to prepare for the upcoming school year is to get restorative rest. It's important to let your brain disengage for a short time, but it's also beneficial to set aside time, before the school year begins, to think about the past school year. What went well? What might you want to do differently?? What techniques are you hoping to improve in the coming school year? As we as a society still reel from the COVID-19 pandemic, meaningfully reflect on the past four years and ask yourself what you've see with your students. What might they need to succeed this upcoming year? How can you facilitate an environment where students are getting supports for the unique challenges that the pandemic created? Incorporate mindfulness into your daily habit. A mindfulness practice is a daily regime of awareness, contemplation, and processing of all the things going on both within and outside of you. Mindfulness is a key skill when it comes to the larger goal of emotional understanding and regulation, and it has been shown to be a particularly helpful practice for teachers. However, you cannot expect to dive into mindfulness on day one of a new school year, it take practice. A great place to start is to pay attention to your emotions and work on emotional awareness in the weeks leading up to the school year. Shift your thinking fromo "emotions are noise that get in the way" to "My emotions are important signals that I have to pay attention to." This type of shift can be difficult to do for the first time in the heat of teaching so summer is a great time to practice these techniques. As educators, teachers experience the full range of human emotions every day, and they are usually the only adults in the room. While this might at the outset seem intimidating, teachers have the unique opportunity to use their emotions intentionally as cues for their students to pick up on. Dr. Jon Cooper, Director of Behavioral Health for the Colonial School District in New Castle, Delaware noted: "We want teachers to be the emotional thermostat, not the thermometer," and "We want them to intentionally set the emotional tone of the classroom." During the summer, think about how to set classroom norms and expectations to be responsive to your emotions and those of your students in a way that will create a more mindful classroom all around. This could look like including a classroom norm stating that aAll emotions are ok, even the bad ones. It could also look like acknowledging in your classroom management approaches that there is a difference between emotions and behaviors; so while all emotions are ok, not all behaviors that come from those emotions are ok. Take yourself through a school day and anticipate the needs of your students. One major mindfulness practice is taking yourself through a typical school day and identifying parts where students are most likely to have difficulties. Do students have challenging moments during small groups? Is there a lot of math anxiety going on in your class? Try structuring your day, approach, even your expressions so that you set yourself and your students up for success during these moments that are more likely to be challenging. Utilize mindfulness websites and apps. There are websites and apps teachers can use to further incorporate mindfulness into their daily lives, including: The Center for Healthy Minds UCLA's Free Mindfulness App For more tips... McLean is available for interviews and can expound on the ways teachers can set themselves – and their students – up for success. Click on her profile to connect.


A recent study on dangerous driving conducted by CAA South Central Ontario (CAA SCO) revealed that more than half of Ontario motorists, 55 per cent, admit to engaging in risky and unsafe driving behaviours in the past year. According to the survey, this number increases to 61 per cent amongst young drivers aged 18 to 34. “Dangerous driving behaviours, such as speeding, distracted driving, and aggressive driving, continue to pose significant risks on our roads,” says Michael Stewart, community relations consultant for CAA SCO. “These actions not only endanger the lives of the drivers themselves but also put all road users at risk. We must prioritize road safety by promoting responsible driving habits." Of those surveyed, the top five dangerous driving behaviours that motorists engaged in are, 1. Speeding (41 per cent) 2. Distracted driving (20 per cent) 3. Unsafe lane changes (9 per cent) 4. Aggressive driving (8 per cent) 5. Running red lights (7 per cent) In contrast, those surveyed say they frequently witnessed others driving dangerously far more often. 1. Speeding (84 per cent) 2. Unsafe lane changes (76 per cent) 3. Aggressive driving (76 per cent) 4. Distracted driving (73 per cent) 5. Running red lights (56 per cent) “The data tells us that it is far more prevalent for people to see others driving dangerously rather than admitting that they themselves are carrying out the same behaviour,” adds Stewart. The survey found that speeding continues to be the leading concern for Ontario motorists, especially on roads with higher speed limits. According to the study, 86 per cent of motorists feel safe on residential streets, compared to only 68 per cent on posted 110-kilometre-per-hour highways. “Ontarians frequently witness dangerous driving behaviours, especially on highways,” says Stewart, “the important thing to remember is that the risk of collision can increase when travelling at higher speeds.” Four out of 10 Ontario drivers will actively avoid roads with ASE Ontario drivers favour stricter fines and penalties to combat the increasing amount of dangerous driving across the province. This year alone, 35 per cent of Ontarians indicated that penalties and fines for speeding and stunt driving have influenced their driving behaviour – up seven per cent from last year. The study also found that more than three-quarters of Ontario drivers (78 per cent) believe that automated speed enforcement (ASE) can help deter drivers from speeding, as 70 per cent of Ontario drivers admit that they will slow down in the presence of an ASE camera. “It is no surprise that Ontario motorists are in favour of stricter penalties as speeding and dangerous driving continue to be an issue,” says Stewart, “what is surprising, however, is that despite the support for ASE, four out of 10 Ontario drivers will actively avoid roads where an ASE is present, an increase from last year.” According to the survey, Ontarians support the presence of ASE on all types of streets, especially near schools (84 per cent) and community centres (81 per cent). A total of 17 per cent of Ontario drivers, equivalent to more than 1.5 million individuals, have received a ticket from an ASE camera in the past. “CAA SCO continues to advocate for road safety for all road users,” says Stewart. “Our hope is that through education and awareness of the repercussions, we can begin to see a steady decrease in dangerous driving across all roads.” For more information, please visit www.caasco.com/speeding The online survey was conducted by DIG Insights from April 1 to April 16, 2024, with 1,509 Ontario drivers aged 18 and older. Based on the sample size of n=1,509 and with a confidence level of 95 per cent, the margin of error for this research is +/- 2%.)


#Expert Insight: Political Fandom
The 2024 Presidential campaign has been a roller coaster ride this summer. The upheavals are so fast and unprecedented that the reaction to each event often seems too muted. An assassination attempt and sudden pre-convention withdrawal? In a past generation, these events would be decisive, but in 2024, they seem like just the latest blip in the news cycle. The polls never seem to move more than a couple of points. In such an oddly volatile but also stable environment, our best bet to understanding what is going to transpire during the last 100 days of the election cycle is to look at data that gets to the heart of how voters view the candidates. My choice of fundamental data or essential metric is candidate fandom. Fandom is an unusual metric in politics, but it should be more common. Fandom is about passion for and loyalty to a cultural entity, be it a team, singer, university, or even politician. In fact, MAGA Trump supporters and Bernie Bros share many characteristics with Swifties and Lakers fans. Fans of all these things show up, spend, wear branded apparel, and fiercely defend the object of their fandom. The politicians who inspire fandom, such as AOC, Donald Trump, Barack Obama, and Marjorie Taylor Green, enjoy many advantages and are the celebrities of the political world. Fandom is critical in politics because fans are loyal, engaged, and resilient. Fans are not casual potential voters who may change preferences and are unlikely to make an effort to stand in line to vote. Fans are the voters who will show up rain or shine and who can’t be swayed. In 2024, a fan will interpret a conviction of their candidate as political “lawfare” rather than evidence of criminality. Also, in 2024, a fan will make excuses for signs of aging that would result in children taking a senior’s car keys. The flip side of fandom, anti-fandom, is also a powerful political force. Indeed, politics may be the cultural context in which anti-fandom has the most impact. Taylor Swift may have haters, but these anti-Swifties are not buying tickets to see Katy Perry in protest. But in politics, hatred of a candidate might be as powerful a tool for generating a vote as fandom. Joe Biden’s 2020 campaign was notoriously bad at drawing crowds, suggesting he inspired little passion. In contrast, Trump’s rallies looked like rabid sports crowds complete with matching hats. However, the hatred and fear of Donald Trump inspired sufficient anti-fandom to make Biden competitive. Of course, fandom doesn’t entirely decide elections. In most elections, there isn’t all that much fandom or passion. Beyond the presidency and senatorial contests, most candidates are barely known, and identity factors (race, gender, party affiliation) and candidate awareness are the determining factors. Even in presidential elections, get-out-the-vote efforts (ballot harvesting) and election regulations (voter suppression) combined with effective marketing to the few percent of swing (low information) voters are often the determining factors. Looking toward the future, fandom may be an increasingly salient political metric for multiple reasons. First, the last two decades have witnessed many candidates raised quickly from obscurity with somehow Hollywood-worthy origin stories (Barack Obama, AOC, JD Vance, etc.). In the modern media environment, candidates’ reputations (brands) are increasingly the product of marketing narratives rather than a lifetime of real-world accomplishments. In this new world of politics, fandom will be a critical metric. Second, with the increasing diversity of the American electorate, voting will be increasingly based on identity rather than ideology. Identity-based voting segments are likely to be driven by fandom (and anti-fandom) rather than policy. We see a form of this in 2024, as high inflation has barely made a dent in voters’ preferences for the two parties. A fragmented electorate comprised of racial and gender segments whose preferences are driven by fandom and anti-fandom will lead to increasingly negative campaigns featuring ads highlighting the threat of the non-preferred party’s candidates. When voters are focused on identity, negative advertising becomes the ideal method to use fear to create anti-fandom (hate) to motivate turnout. Kamala Harris versus Donald Trump Barring further disruptions, the matchup is set for the 2024 presidential contest (as of this writing, we do not know the Democratic VP). We do know the matchup between Donald Trump and Kamala Harris is a contest between polarizing figures. Donald Trump is a movement candidate who has redefined the Republican party. He inspires passionate fandom from his followers and amazing antipathy from major media and cultural outlets. Harris is also polarizing. In the immediate aftermath of Biden’s withdrawal, Harris received massive media and donor support. However, Harris has not demonstrated any significant national voter appeal, and her time as VP has generated ample blooper real material. My approach to assessing the race is to examine each candidate's fandom and anti-fandom. Fandom is the candidate’s core, resilient support, while anti-fandom is about antipathy. Fandom and anti-fandom are especially powerful metrics for a candidate because they are relatively fixed after a candidate gains high awareness. Once an individual identifies with the candidate (e.g., they are on the same team), an attack on the candidate is an attack on the individual. This means attack ads do not work because fans feel they are being attacked. Anti-fans are also important because they constrain a candidate’s support. A Trump anti-fan is unpersuadable by efforts from the Trump campaign because their identity is steeped in opposition to him. Fans and anti-fans are trapped in a cycle of confirmation bias where all information is processed to fit their fandom. I use data from the Next Generation Fandom Survey to assess candidate fandom and anti-fandom. The Next Generation Fandom Survey involves a nationwide sample of the U.S. population regarding fandom for sports and other cultural entities. In the 2024 edition, political figures such as Donald Trump, Joe Biden, Kamala Harris, and RFK Jr were included. The survey captured responses from 2053 subjects split evenly across the four primary generations (Gen Z, Millennials, Gen X, and Baby Boomers), and the sample is representative in terms of racial background. The survey does not focus on likely or registered voters, so the results reflect overall societal sentiments rather than the electorate's opinions. The critical survey question asks subjects to rate how much of a fan they are of a celebrity on a 1 to 7 scale. In the following discussion, individuals who rated their fandom a 6 or 7 on the 7-point scale are categorized as Fans, while those who rate their fandom a 1 or 2 are classified as Anti-Fans. Table 1 shows the Fandom and Anti-Fandom rates for the entire sample. Donald Trump has a 27% fandom rate compared to Harris's 21%. The fandom rate is crucial because it identifies the candidate's core support. It also indicates something important about the candidate’s potential likability. In terms of anti-fandom, Harris has a slightly higher Anti-Fandom rate. Anti-Fandom is also critical as it shows the percentage of people who hate a candidate. The data suggests that Americans find Harris to be more dislikable than Trump. Notably, the anti-fandom rates are significantly higher than the fandom rates. The American public has significant disdain for politicians. The high anti-fandom rates are both the product of past negative advertising and the cause of future negative campaign strategies. Table 1: Candidate Fandom and Anti-Fandom Table 2 reports fandom rates based of the two gender segments. Trump has a 7%-point advantage with men and a surprising 4% advantage with women. This is a stunning result as Trump is generally regarded as having weakness with female voters. However, this weakness shows up in the anti-fandom rates. In the male segment, Trump has a 5%-point advantage in anti-fandom (fewer anti-fans), but a 3% disadvantage in the female segment. This reveals that Trump is polarizing to women, and almost half of women find Trump to be highly dislikable. This finding is why the Harris campaign is likely to use advertising that casts Trump as misogynistic or a threat to women to motivate turnout by female voters. Table 2: Candidate Fandom by Gender Table 3 shows the fandom rates for the two younger demographic segments: Gen Z and Millennials. This Table also shows Trump’s relative performance versus Biden (in parentheses in the last column). Trump enjoys higher fandom and lower anti-fandom than Harris in both the Gen Z and Millennial segments. In terms of fandom, Trump is plus 6% in Gen Z and plus 11% with Millennials. Critically, Harris outperforms Biden. The Gen Z anti-fandom gap between Trump and Biden favored Trump by 6% points. However, this gap shrinks to just 1% point when Harris is the comparison. The data suggests that Harris is stronger with Gen Z than Biden. Table 3: Candidate Fandom in Younger Generations Table 4 reports the fandom rates based on a racial segmentation scheme. Specifically, the sample is divided into White and Non-White categories. This is a crude segmentation, but it illustrates some essential points. Trump enjoys a significant 14% positive fandom advantage in the White demographic. He also enjoys a 10-point edge in (lower) anti-fandom. The pattern essentially reverses in the Non-White segment, as Harris has a 10-point advantage in fandom and a 17-point edge in anti-fandom. Trump’s anti-fandom in the Non-White segment is critical to the campaign. Nearly half of this segment has antipathy or hate for Trump. This high anti-fandom suggests an opportunity for the Harris campaign to emphasize racial angles in their attacks on Trump. Table 4: Candidate Fandom by Race In addition to fandom and anti-fandom rates across demographic categories, insights can be gleaned by looking at segmentation variables that reflect cultural values or personality. Table 5 shows fandom and anti-fandom rates for Trump and Harris for segments defined by fandom for Taylor Swift (Swifties) and Baseball. The Swifties skew towards Harris. The implication is that young women engaged in popular culture have more positive fandom for Harris and more negativity toward Trump. This is unsurprising given the content of the popular culture and Swift’s personal liberalism. The Swiftie segment shows a much stronger skew for Harris than all but the Non-White segment. Examining the data at a cultural level is vital as it indicates that it isn’t necessarily youth or gender where Harris has an advantage but a combination of youth, gender, and a specific type of cultural engagement. The table also includes fandom rates for baseball fans. In the Baseball Fan segment, Trump enjoys an 8% point fandom advantage and a 7% anti-fandom advantage (lower anti-fandom). Like the case of the Swifties, the fandom rates of Baseball Fans reveal something about Trump’s core support. Baseball is a very traditional game with an older fan base, and traditionalism is probably the core value of Trump fans. Trump’s negative advertising is likely to focus on the threats to traditional values (i.e., Harris is a San Francisco liberal). Table 5: Candidate Fandom and Cultural Segments Commentary and Prediction Fandom is a powerful metric for predicting political success, but like most data points, it doesn’t tell the whole story. Fandom is a measure of unwavering core support while anti-fandom measures the group that will never support and is likely to show up to vote against a candidate. Examining fandom rates across multiple segments reveals that Harris’ core support is concentrated in specific cultural and racial segments. The analysis also suggests that Trump's core support is broader than is usually acknowledged and that his main problem is significant anti-fandom with women and minorities. Harris’ problem is a lack of love, while Trump’s is too much hate. Notably, I am not paying too much attention to the current wave of excitement and enthusiasm surrounding Harris. The recent enthusiasm is likely more a manifestation of the Democratic base’s hopes and a relentless media onslaught than an actual increase in passion for Harris. Maybe there will be a permanent shift upward in Harris’s fandom, but I don’t see any logic for why this would occur. Harris isn’t suddenly more likable or aspirational than she was last month. The argument that the American people are becoming more acquainted with her is dubious, given that she has been the Vice President or a major presidential candidate for almost five years. What are the implications for the upcoming election? Voting is not only about fandom or hate, so we must consider some additional factors. For instance, many potential voters lack passion and knowledge and are more prone to vote based on identity rather than ideology. If a region or demographic segment consistently votes for a party 75% of the time, that’s voting more based on fixed identities than current societal conditions. The American electorate has many of these types of fixed-preference voter segments. Furthermore, as the American electorate becomes more diverse, identity-based voting seems to be making presidential contests more predictable. The baseline seems to be that the Democratic candidate will win the popular vote by a few percentage points, and the Electoral College will come down to a few states, such as Michigan, Pennsylvania, and Wisconsin. Examining past electoral maps shows far more shifting of states across elections. Now, all but a handful of states are regarded as non-competitive. The Figure below shows the presidential popular vote margins for the last 50 years. It shows a trend towards smaller margins for the winning candidate, which is at least partly due to growing ethnic diversity and more fixed (at least in the near and medium terms) identity-based voting. Over the last 13 cycles, the margin of victory has dropped by about 1% every four years. Demographic change has also locked in a high baseline level of support for Democratic candidates. The last time a Republican won the popular vote was in 2004, with George Bush as the incumbent. Figure 1: Presidential Vote Margin 1972 to 2020 In addition to shrinking election margins, demographic change promises to change future campaign tones. The increasing relevance of fandom and anti-fandom, combined with the growing diversity of the electorate, will make 2024 an extremely negative campaign. The 2024 election will be determined by identity-based demographic trends and negative (anti-fandom) marketing campaigns. Demographics are destiny, and America is changing rapidly in ways that make it increasingly difficult for the Republicans to win the popular vote. It doesn’t matter if the Democrat is Harris, Newsom, Clinton, or Whitmer while the Republican is Rubio, Haley, Cruz, or Burgum. The baseline is probably 52% to 48%, D to R. Candidate fandom and anti-fandom probably shift the vote 2 or 3 percent in either direction. The correlation of demographic traits with voting behaviors creates incentives for campaign strategies that focus on identity. Republicans are eager to shift some percentage of Black or Hispanic voters to their cause because it simultaneously reduces the Democrats' base and grows Republican totals. In contrast, Democrats need to motivate marginal voters in the female, Black, and Hispanic segments to turn out. Fear-based appeals are the most effective tool for both parties' goals. Negative messaging is also prevalent because of the general view of politicians. Politicians tend to inspire more antipathy (anti-fandom) than admiration (fandom). The fandom data shows this, as both candidates have far more anti-fans than fans (this holds with other politicians) . The modern election calculus is, therefore, focused on aggressive negative ads that inspire marginal voters to take the initiative to vote against a hated candidate. Passion drives behavior, and it's far easier to drive fear and hatred of a candidate than to inspire passion and admiration. Considering the fandom data and the current electorate, I have two predictions. First, we will witness an incredibly nasty race. Harris’s best bet is to demonize Trump to motivate the anti-Trump voters to turn out. The American culture of 2024 includes constant repetition that many Democratic voting constituencies are marginalized and threatened. These segments are best motivated by using messages that cast the Republicans as the danger or oppressor. Women will fear losing reproductive rights, and African Americans will be primed with threats to voting rights. Trump will also employ negative messaging, but Trump’s adoption of a negative campaign comes from a slightly different motivation. Trump’s core support consists of conservatives who are frustrated by a lack of cultural power and representation. This group is looking for someone who will fight for their values. This desire for a “fighting advocate” explains much of Trump’s appeal, as his supporters are enthusiastic about his “mean tweets and nicknames.” There will also be fear-based advertising as Harris will be positioned as wanting to defund police and open the border. Second, Trump wins in a close contest. Comparing Trump’s and Harris’ fandom and anti-fandom suggests the Harris campaign faces an uphill challenge. Despite the current blitz of enthusiasm for Harris as a replacement for a failing Joe Biden, her “brand” has not shown an ability to stimulate passion, and her dislike levels exceed Trump's. It seems unlikely that she will be able to inspire fans. While Trump has a significant fanbase and weaknesses in terms of strong anti-fandom levels in minority and cultural segments, he probably beat Clinton in 2016 because her anti-fandom was equivalent to his. In contrast, he lost to Biden because Biden had less anti-fandom (in 2020). Kamala Harris seems more like Clinton than Biden, so look for a similar outcome as in 2016. The bottom-line prediction: An exceptionally negative campaign, with Trump’s greater baseline fandom and Harris’s charisma deficit leading to a narrow Trump victory. As in 2016,Trump wins the Electoral College while losing the popular vote. Addendum: Future Fandom Lesson The structure of the American electorate and the propensity of people to vote based on identity rather than ideology mean that negative campaigns are the standard in the near future. The essential observation is that demographic trends create an electorate that is more a collection of identity segments than a homogeneous population that varies in ideology. An increasingly diverse electorate likely means increasingly negative presidential campaigns as negative or fear-based appeals are especially effective when elections focus on threats to identity groups. The tragedy of this situation is that the negative messages of campaigns amplify racial division and acrimony. When the next election occurs, the electorate is even more polarized, and negative or fear-based appeals are again the most effective. Mike Lewis is an expert in the areas of analytics and marketing. This approach makes Professor Lewis a unique expert on fandom as his work addresses the complete process from success on the field to success at the box office and the campaign trail. Michael is available to speak with media - simply click on his icon now to arrange an interview today. Interested in following Future Fandom! Subscribe for free to receive new posts.

Could This Be the Ultimate Way to Showcase Your Experts?
Getting more media coverage is all about helping journalists find everything they need to get their stories out on deadline. Simple right? Well, that depends. Our research shows that most media relations and comms departments are significantly resource-constrained when it comes to pitching experts. And even when you are pitching it’s a challenge. Industry research shows that 97% of pitches fail to generate coverage. The secret is to publish content that draws in journalists in a way that helps them immediately understand (within seconds) how you can help them enhance their stories with your experts. What if there was a way to get all this done in minutes? Not days. Welcome to our latest Spotlight release, designed to help you organize your expert content in the most engaging ways possible. We’ve made enhancements in 5 key areas: Create a More Engaging Design that is Optimized for Mobile Your brand’s identity matters. Our new design ensures your Spotlight Posts reflect your unique style and voice. With bolder headers, enhanced logo placements, customizable fonts, and color schemes, you can create more visually stunning posts. And unlike a lot of other websites, your pages will be beautifully optimized for mobile—which is how most journalists will see your content. Tell a More Visual Story with Images Research from HubSpot indicates that content with relevant images gets 94% more views than content without. It’s time to get more visual. With our higher image resolution plus new editing tools like text wrap and captions, you can really make your images stand out. Plus we’ve helped solve the problem of sourcing images. We’ve now added access to thousands of royalty-free stock images for your posts - it’s all covered as part of your ExpertFile subscription. Make Your Experts Really Stand Out We’ve now made it even easier to display your experts more prominently with enhanced “expert callouts,” which are specially designed to engage journalists with the key information they are looking for. And our pagination features allow you to add content that sets your experts apart. Within seconds you can add videos and images or even stylized quotes from your previous media coverage. Leverage the Latest AI Tools for Faster Content Creation We’ve turbocharged our AI writing tools using OpenAI’s latest release. Enhance your content by generating innovative story ideas and draft posts with AI. This power is all conveniently built right into our editor to save you time. Save Time with Content Repurposing Creating high-quality content takes time and effort, and we want to help you get the most out of it. With our new publishing date feature, along with our current scheduling capabilities, it is easier than ever to make use of existing content effectively. This gives it a second life as part of your expertise marketing efforts while allowing you to better connect it to your experts to drive inquiries. Clone Your Posts for Even Faster Creation. Being able to leverage that perfectly crafted post going forward quickly and easily can help you jump on opportunities as they present themselves. With cloning you can take the layout elements and simply updated the content to highlight new experts or areas of expertise that you wish to showcase. And that's not all… You’ll still enjoy all the current benefits of "Spotlight Posts," including distribution through expertfile.com, integration into expert profiles, full SEO compliance with advanced meta and schema data, and various options for adding this valuable content to your website. Ready to elevate your expertise marketing game? Dive into these new features and watch your content—and your experts—shine brighter than ever. Want to see it in action? Check out the sample we’ve shown here, which we generated with Milwaukee School of Engineering (MSOE) to feature their experts during the Republican National Convention. We can also set you up with a customized demo showing how all this can make your experts stand out. Let us know what you think! About ExpertFile ExpertFile is changing the way organizations tap into the power of their experts to drive valuable inquiries, accelerate revenue growth, and enhance their brand reputation. Used by leading corporate, higher education and healthcare clients worldwide, our award-winning platform helps teams structure, manage and promote their expert content while our search engine features experts on over 50,000+ topics. Download our "Guide to Expertise Marketing", book a demo and more here.


Sport and Study: Villanova University Faculty Offer Academic Lens to Paris Olympics Storylines
All eyes are on Paris: more than 10,000 athletes from 206 nations are set to compete in the Games of the XXXIII Olympiad, the third Olympics in the City of Love and the first since 1924. Below, Villanova University faculty members provide their academic expertise on the unique storylines and narratives already taking place as Paris 2024 gets underway. Portraying a National Image in the Opening Ceremony Étienne Achille, PhD Director of French and Francophone Studies After months of speculation, the daily Le Parisien has officially confirmed that renowned French-Malian singer Aya Nakamura will lend her vocals to an opening ceremony featuring an iconic backdrop steeped in history. “Nakamura is the most-streamed Francophone singer in the world, embodying France’s culture on a global stage, and she’ll be paying homage to one of the most cherished representatives of the chanson française,” said Dr. Achille, referring to reports she will sing one of beloved French crooner Charles Aznavour’s greatest hits. According to Dr. Achille, the pop star’s presence is significant and symbolic. “A performer, or even a flagbearer, can easily become the face of a global event like the Olympics,” he said. The details of the setting for the ceremony – in the heart of Paris, along the Seine – are just as intentionally symbolic. “Not only will this be the first opening ceremony to take place entirely outside of a stadium; its location along the river and the fact the delegations will be on boats are key. “It represents movement and connection to the world,” Dr. Achille said. “And Nakamura’s performance projects the image of a modern, multi-ethnic nation building on tradition while proudly marching into the future.” Swimming in the Seine: Safe or Not? Metin Duran, PhD Professor of Civil and Environmental Engineering It is, perhaps, the most-asked question of the last few weeks. Is the Seine River, set to host multiple swimming events, safe? The river has been illegal to swim in for a century due to the presence of harmful bacteria such as E. Coli, and recent testing has reaffirmed this concern. The Seine, which had undergone an expensive cleaning to mitigate this issue, received the endorsement of Paris Mayor Ann Hidalgo, who personally took a dip in the water herself to attest to its safety. The stunt did little to convince experts such as Dr. Duran, who studies wastewater, to abandon concern about the potential health risks of athletes being exposed to pathogens in the water. “When we have fecal pollution, there is a high likelihood of pathogens being present,” Dr. Duran said. “Those could be viral, like a norovirus, or protozoan. “If you’re swimming in that water, you run the risk of ingesting it. Once you ingest that polluted water, you’re likely to contract some of those disease-causing pathogens. Ingesting this water doesn’t mean you’re necessarily going to get sick, but based on the number of people in a big city like Paris, there is a very high likelihood of some of these pathogens existing now in the river.” Accommodations for Breastfeeding Athletes Sunny Hallowell, PhD, APRN, PPCNP-BC Associate Professor of Nursing The IOC and Paris 2024 Organizing Committee is providing support to all breastfeeding athletes competing in the Games. A few national governing bodies, like the French Olympic Committee, are going a step further and offering hotel rooms near the Village for their country’s breastfeeding athletes to share with their children and spouses. “A few decades ago, the idea of a female athlete who also wanted to breastfeed their child was so taboo it may have prevented an athlete from competing,” said Dr. Hallowell. “Now, many female athletes who choose to breastfeed their newborns or toddlers conceptualize breastfeeding as another normal function of their remarkably athletic bodies.” Accommodation for breastfeeding athletes and increased awareness are needed more than ever. Dr. Hallowell notes that in addition to changing views on breastfeeding, the needs for such accommodations are increasing as the age of peak athletic performance also increases. “Advances in sports nutrition, wellness and lifestyle have extended the longevity and performance of many athletes into adulthood,” she said. And while some athletes with rigorous training regimens might feel “frustrated incorporating breastfeeding into the routine,” Dr. Hallowell says that for others, “breastfeeding provides both physical and socio-emotional benefits for the mother and the infant that allow the athlete to focus on the job of competition.” Protecting Against the Parisian Heat Ruth McDermott-Levy, PhD, MPH, RN, FAAN Professor of Nursing The potential for extreme heat in Paris has been a topic of concern for athletes and organizers, prompting certain outdoor events to be proactively scheduled at times to avoid the day’s worst heat. Current forecasts predict temperatures in the 90s for several days early on in the Games, which could be exacerbated by Paris’ reputation as an urban heat island, unable to cool due to lack of green space and building density. Dr. McDermott-Levy says the athletes are inherently vulnerable, because “the added stress of physical exertion during their events puts them at greater risk of heat-related illness.” But she also notes that many of the athletes have likely undergone pre-competition training in extreme heat conditions to acclimate and will have trainers and health professionals monitoring them frequently. “The group of concern are the workers at the stadiums, outdoor workers and spectators who are there to enjoy or work at the events and may have had little to no acclimation,” Dr. McDermott-Levy said. “They need to follow local instructions and take frequent breaks from the heat, seek shade and maintain hydration by avoiding alcohol and sugary drinks and drinking water.” How Nature Can Inspire Future Use of Olympic Infrastructure Alyssa Stark, PhD Assistant Professor of Biology Gone, hopefully, are the days of abandoned Olympic Villages and venues, overrun with weeds and rendered useless soon after the Games conclude. The IOC’s commitment to sustainability has been transparently relayed ahead of the 2024 Games, featuring a robust range of initiatives and programs. Dr. Stark is particularly interested in one aspect of ensuring a sustainable Olympics. “How will the structures, materials and systems they developed for the Olympics be re-used, re-shaped or re-worked afterward?” she posed. “This could include re-using buildings to larger scale or re-working transportation systems set in place for the Games that could then integrate into day-to-day life post Olympics.” At the root of her interest is the concept of biomimicry. “A lot of the way we think about designing, if we’re using this biomimicry lens, is how do we learn from nature to solve problems that we have in a sustainable way, keeping in mind the environment we are in?” Dr. Stark said. In this case, consider how something like a dwelling of a living creature might be repurposed to fit the needs of another creature, or serve another natural purpose, without harming the ecosystem. Could that inspire a way to re-use the Olympic infrastructure? “There are a ton of examples of [biomimicry] being used and working in products,” Dr. Stark said. “But I would say the next step is looking at the social levels of these big ecosystems – building architecture, city planning, flow of information and, in this instance, repurposing what was created for the Olympics.” Paris Could Be a Transportation Model for Major City Events in the United States Arash Tavakoli, PhD Professor of Civil and Environmental Engineering Paris has invested 250 million Euro the last several years to transform the city to a 100% cycling city, making it one of the most bike-friendly municipalities in the world. Currently, more trips are being made by bicycles in Paris than by cars (11% vs. 4%), a trend that has permeated to the surrounding suburbs as well. With an influx of travelers in Paris for the Games, Dr. Tavakoli, an expert in human transportation, said, “The Olympics will be a test for how well these kinds of systems respond to high fluctuations in the population as compared to vehicle-centric systems.” While Paris is thousands of miles away from the United States, how bicycle, pedestrian and vehicle systems work during the Games could provide helpful insight ahead of major events in American cities. “With the World Cup coming to the U.S. in a few years, it will be interesting to compare [Paris] with how our own system responds to people’s needs,” Dr. Tavakoli said. “Not just based on traffic data and congestion, but also considering factors like how comfortable the transportation system is, how much it affects our well-being and how much it attracts a nonresident to enjoy the U.S. when their only option, for the most part, is a vehicle.”


Can political polarization threaten American democracy?
Partisan hostility in the United States is at a fever pitch and is a dominant theme in the 2024 election cycle. But how much does it matter to everyday life in America? What is really at stake? James Druckman, a professor of political science at the University of Rochester who is widely considered one of the country's foremost experts on political polarization and its impact on American democracy, is poised to answer those questions and back up his conclusions with data. His latest book, Partisan Hostility and American Democracy: Explaining Political Divisions and When They Matter, outlines the potential consequences of extreme partisan animus by distilling empirical evidence gathered between 2019 and 2021. The upshot? Partisan hostility alone is unlikely to lead to the collapse of American democracy. But it nonetheless has a deleterious effect on democracy and could erode democratic institutions and functioning over time. In the end, the book concludes, American democracy hinges more on how political leaders respond to the polarization than the polarization itself. Druckman has been cited by The New York Times columnist Thomas Edsall as among the political scientists in the country "working on getting us to hate one another less."


Global Technology Outage Raises Concerns About Ease of Future Cybersecurity Attacks
The world came to a standstill after a technology outage reported Thursday evening grounded airplanes, disconnected hospitals and shut down banks across the globe. A faulty software update was to blame, not cybercriminals, but Florida Tech assistant professor TJ O’Connor said the outage’s cascading effect points to larger concerns about our society’s reliance on the internet. The outage, which affected users’ ability to access Microsoft 365 applications, was traced back to a defect found in a software update from cybersecurity company CrowdStrike. CrowdStrike quickly released a statement confirming that the outage was “not a security incident or cyberattack.” The outage was nonetheless damaging, kicking institutions offline. Issues remained more than a day later. “Once those services go down, there’s this massive cascading effect,” O’Conner said. “If bank processing doesn’t work, then aviation doesn’t work. If aviation doesn’t work, shipping doesn’t work.” Ultimately, O’Connor explained, the biggest concern isn’t the glitch in the system; it’s the number of systems that broke because CrowdStrike wasn’t working. “I think what we’ll see a lot of people learn from this CrowdStrike incident is…that if they want to take the internet down in the future, all they have to do is hit one target,” O’Connor said. “It makes the threat landscape a lot smaller to attack for an adversary.” Over the course of several hours, a blue Microsoft error screen taunted companies worldwide. Airlines including Delta, American and Frontier grounded all flights. Several television news outlets, including the United Kingdom’s Sky News, were unable to hold live broadcasts. Some of the biggest concerns lie in the hospital industry, where planning, evaluation and continuous monitoring are essential, O’Connor noted. “[Hospitals] are constantly processing so much data, and for them to go out for a couple of hours means that decisions aren’t being made on an automated basis,” O’Connor said. “We’ve kicked over so much of our decision making to automated systems that we can’t let those networks fail.” According to the United Kingdom’s National Health Service (NHS), the outage disrupted its appointment and patient record system. Mass General Brigham in Boston, Massachusetts was also one of several U.S. hospitals that cancelled non-urgent surgeries, procedures, and medical visits because of the disruption. 911 outages were also reported in several states, including Phoenix, Arizona, whose computerized dispatch center was affected, the police department posted on social media. In Portland, Oregon, Mayor Ted Wheeler issued a citywide state of emergency due to the outage’s impact on city servers, computers and emergency communications. Although CrowdStrike confirmed the incident was not malicious, O’Connor said it raises questions about overall reliance on the internet to make decisions, as well as ineffectiveness in securing it. “We continually have these wake-up moments where something happens, it’s large scale, it’s a news blip, and then we forget about it… but our adversaries don’t,” O’Connor said. “Unfortunately, the attack infrastructure and the ability to attack is getting easier and easier.” O’Connor also expects future network attacks to get worse, calling the unstable global environment a “national-level issue to address.” While large-scale attacks and outages are mostly out the individuals’ control, O’Connor said, people can take action to protect themselves from personal cybersecurity attacks by using multi-factor authentication as much as possible. Looking to know more? Dr. TJ O’Connor’s research is focused on cybersecurity education, wireless protocols, software-defined radio and machine learning. If you're looking to connect with Dr. O'Connor - simply click on his icon now to arrange an interview today.
