Experts Matter. Find Yours.
Connect for media, speaking, professional opportunities & more.

Surprising Jobs Report: What It Means for the U.S. Economy
In news that far surpassed expectations, the U.S. added 254,000 jobs in September. The unemployement rate is also heading in the right direction with a slight dip this past month, resulting in a rate of 4.1%. This update comes after an agressive rate cut by the Federal Reserve. Economic expert, Jared Pincin, has pointed out the motivation behind the rate cut and the possible outcomes. Here are some key points and connections to the September job report from an article he was recently featured in: The rate cut was a signal that the Federal Reserve is now prioritizing the job market rather than inflation and it could be a sign that the ecomony is slowing. However, after the latest job report that blew expectations out of the water, could the ecomony be headed in a better direction? After this job report that added almost double the jobs projected, will the Federal Reserve continue to focus on employment rather than inflation? The Federal Reserve will meet again in November to discuss rate cuts. Will this strong jobs report give them flexibility as they gather to make decisons right after the U.S. election? If you are covering the recent jobs report or the U.S. economy and need to know more, let us help with your questions and stories. Dr. Jared Pincin is an expert on this subject and is available to speak to media regarding the job market and what this means for families in the United States – simply click on his icon or email mweinstein@cedarville.edu to arrange an interview.


Covering the Fed's Interest Rate Decision? Our Expert can Help
The Federal Open Market Committee has three meetings left in 2024 and markets expect interest rates to be cut. This could have a serious impact on the economy as inflation trends downward and restrictive monetary policies are now ready to be loosened. There will be a lot of media attention and speculation around the September 18 decision and its anticipated effects on the global economy. It's why experts like Florida Atlantic's William Luther are ready to help with any questions or coverage. William J. Luther, Ph.D., is an associate professor of economics at Florida Atlantic University, director of the American Institute for Economic Research’s Sound Money Project, and an adjunct scholar with the Cato Institute’s Center for Monetary and Financial Alternatives. The Social Science Research Network currently ranks him in the top five percent of business authors. *** Recent Media: Fox News: GOBankingRates: Newsweek: William Luther, Ph.D., an assistant professor in FAU’s Economics Department, has expertise in economic growth, monetary policies, business cycles and cryptocurrencies. Luther’s research has obtained media interest across the nation, including recent coverage by The Wall Street Journal, Politico and Florida Trend. If you're looking to know more - let us help. Simply click on William's icon now to set up an interview today.


#Expert Insight: Political Fandom
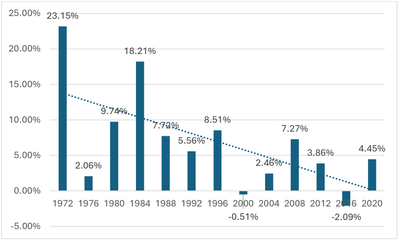
The 2024 Presidential campaign has been a roller coaster ride this summer. The upheavals are so fast and unprecedented that the reaction to each event often seems too muted. An assassination attempt and sudden pre-convention withdrawal? In a past generation, these events would be decisive, but in 2024, they seem like just the latest blip in the news cycle. The polls never seem to move more than a couple of points. In such an oddly volatile but also stable environment, our best bet to understanding what is going to transpire during the last 100 days of the election cycle is to look at data that gets to the heart of how voters view the candidates. My choice of fundamental data or essential metric is candidate fandom. Fandom is an unusual metric in politics, but it should be more common. Fandom is about passion for and loyalty to a cultural entity, be it a team, singer, university, or even politician. In fact, MAGA Trump supporters and Bernie Bros share many characteristics with Swifties and Lakers fans. Fans of all these things show up, spend, wear branded apparel, and fiercely defend the object of their fandom. The politicians who inspire fandom, such as AOC, Donald Trump, Barack Obama, and Marjorie Taylor Green, enjoy many advantages and are the celebrities of the political world. Fandom is critical in politics because fans are loyal, engaged, and resilient. Fans are not casual potential voters who may change preferences and are unlikely to make an effort to stand in line to vote. Fans are the voters who will show up rain or shine and who can’t be swayed. In 2024, a fan will interpret a conviction of their candidate as political “lawfare” rather than evidence of criminality. Also, in 2024, a fan will make excuses for signs of aging that would result in children taking a senior’s car keys. The flip side of fandom, anti-fandom, is also a powerful political force. Indeed, politics may be the cultural context in which anti-fandom has the most impact. Taylor Swift may have haters, but these anti-Swifties are not buying tickets to see Katy Perry in protest. But in politics, hatred of a candidate might be as powerful a tool for generating a vote as fandom. Joe Biden’s 2020 campaign was notoriously bad at drawing crowds, suggesting he inspired little passion. In contrast, Trump’s rallies looked like rabid sports crowds complete with matching hats. However, the hatred and fear of Donald Trump inspired sufficient anti-fandom to make Biden competitive. Of course, fandom doesn’t entirely decide elections. In most elections, there isn’t all that much fandom or passion. Beyond the presidency and senatorial contests, most candidates are barely known, and identity factors (race, gender, party affiliation) and candidate awareness are the determining factors. Even in presidential elections, get-out-the-vote efforts (ballot harvesting) and election regulations (voter suppression) combined with effective marketing to the few percent of swing (low information) voters are often the determining factors. Looking toward the future, fandom may be an increasingly salient political metric for multiple reasons. First, the last two decades have witnessed many candidates raised quickly from obscurity with somehow Hollywood-worthy origin stories (Barack Obama, AOC, JD Vance, etc.). In the modern media environment, candidates’ reputations (brands) are increasingly the product of marketing narratives rather than a lifetime of real-world accomplishments. In this new world of politics, fandom will be a critical metric. Second, with the increasing diversity of the American electorate, voting will be increasingly based on identity rather than ideology. Identity-based voting segments are likely to be driven by fandom (and anti-fandom) rather than policy. We see a form of this in 2024, as high inflation has barely made a dent in voters’ preferences for the two parties. A fragmented electorate comprised of racial and gender segments whose preferences are driven by fandom and anti-fandom will lead to increasingly negative campaigns featuring ads highlighting the threat of the non-preferred party’s candidates. When voters are focused on identity, negative advertising becomes the ideal method to use fear to create anti-fandom (hate) to motivate turnout. Kamala Harris versus Donald Trump Barring further disruptions, the matchup is set for the 2024 presidential contest (as of this writing, we do not know the Democratic VP). We do know the matchup between Donald Trump and Kamala Harris is a contest between polarizing figures. Donald Trump is a movement candidate who has redefined the Republican party. He inspires passionate fandom from his followers and amazing antipathy from major media and cultural outlets. Harris is also polarizing. In the immediate aftermath of Biden’s withdrawal, Harris received massive media and donor support. However, Harris has not demonstrated any significant national voter appeal, and her time as VP has generated ample blooper real material. My approach to assessing the race is to examine each candidate's fandom and anti-fandom. Fandom is the candidate’s core, resilient support, while anti-fandom is about antipathy. Fandom and anti-fandom are especially powerful metrics for a candidate because they are relatively fixed after a candidate gains high awareness. Once an individual identifies with the candidate (e.g., they are on the same team), an attack on the candidate is an attack on the individual. This means attack ads do not work because fans feel they are being attacked. Anti-fans are also important because they constrain a candidate’s support. A Trump anti-fan is unpersuadable by efforts from the Trump campaign because their identity is steeped in opposition to him. Fans and anti-fans are trapped in a cycle of confirmation bias where all information is processed to fit their fandom. I use data from the Next Generation Fandom Survey to assess candidate fandom and anti-fandom. The Next Generation Fandom Survey involves a nationwide sample of the U.S. population regarding fandom for sports and other cultural entities. In the 2024 edition, political figures such as Donald Trump, Joe Biden, Kamala Harris, and RFK Jr were included. The survey captured responses from 2053 subjects split evenly across the four primary generations (Gen Z, Millennials, Gen X, and Baby Boomers), and the sample is representative in terms of racial background. The survey does not focus on likely or registered voters, so the results reflect overall societal sentiments rather than the electorate's opinions. The critical survey question asks subjects to rate how much of a fan they are of a celebrity on a 1 to 7 scale. In the following discussion, individuals who rated their fandom a 6 or 7 on the 7-point scale are categorized as Fans, while those who rate their fandom a 1 or 2 are classified as Anti-Fans. Table 1 shows the Fandom and Anti-Fandom rates for the entire sample. Donald Trump has a 27% fandom rate compared to Harris's 21%. The fandom rate is crucial because it identifies the candidate's core support. It also indicates something important about the candidate’s potential likability. In terms of anti-fandom, Harris has a slightly higher Anti-Fandom rate. Anti-Fandom is also critical as it shows the percentage of people who hate a candidate. The data suggests that Americans find Harris to be more dislikable than Trump. Notably, the anti-fandom rates are significantly higher than the fandom rates. The American public has significant disdain for politicians. The high anti-fandom rates are both the product of past negative advertising and the cause of future negative campaign strategies. Table 1: Candidate Fandom and Anti-Fandom Table 2 reports fandom rates based of the two gender segments. Trump has a 7%-point advantage with men and a surprising 4% advantage with women. This is a stunning result as Trump is generally regarded as having weakness with female voters. However, this weakness shows up in the anti-fandom rates. In the male segment, Trump has a 5%-point advantage in anti-fandom (fewer anti-fans), but a 3% disadvantage in the female segment. This reveals that Trump is polarizing to women, and almost half of women find Trump to be highly dislikable. This finding is why the Harris campaign is likely to use advertising that casts Trump as misogynistic or a threat to women to motivate turnout by female voters. Table 2: Candidate Fandom by Gender Table 3 shows the fandom rates for the two younger demographic segments: Gen Z and Millennials. This Table also shows Trump’s relative performance versus Biden (in parentheses in the last column). Trump enjoys higher fandom and lower anti-fandom than Harris in both the Gen Z and Millennial segments. In terms of fandom, Trump is plus 6% in Gen Z and plus 11% with Millennials. Critically, Harris outperforms Biden. The Gen Z anti-fandom gap between Trump and Biden favored Trump by 6% points. However, this gap shrinks to just 1% point when Harris is the comparison. The data suggests that Harris is stronger with Gen Z than Biden. Table 3: Candidate Fandom in Younger Generations Table 4 reports the fandom rates based on a racial segmentation scheme. Specifically, the sample is divided into White and Non-White categories. This is a crude segmentation, but it illustrates some essential points. Trump enjoys a significant 14% positive fandom advantage in the White demographic. He also enjoys a 10-point edge in (lower) anti-fandom. The pattern essentially reverses in the Non-White segment, as Harris has a 10-point advantage in fandom and a 17-point edge in anti-fandom. Trump’s anti-fandom in the Non-White segment is critical to the campaign. Nearly half of this segment has antipathy or hate for Trump. This high anti-fandom suggests an opportunity for the Harris campaign to emphasize racial angles in their attacks on Trump. Table 4: Candidate Fandom by Race In addition to fandom and anti-fandom rates across demographic categories, insights can be gleaned by looking at segmentation variables that reflect cultural values or personality. Table 5 shows fandom and anti-fandom rates for Trump and Harris for segments defined by fandom for Taylor Swift (Swifties) and Baseball. The Swifties skew towards Harris. The implication is that young women engaged in popular culture have more positive fandom for Harris and more negativity toward Trump. This is unsurprising given the content of the popular culture and Swift’s personal liberalism. The Swiftie segment shows a much stronger skew for Harris than all but the Non-White segment. Examining the data at a cultural level is vital as it indicates that it isn’t necessarily youth or gender where Harris has an advantage but a combination of youth, gender, and a specific type of cultural engagement. The table also includes fandom rates for baseball fans. In the Baseball Fan segment, Trump enjoys an 8% point fandom advantage and a 7% anti-fandom advantage (lower anti-fandom). Like the case of the Swifties, the fandom rates of Baseball Fans reveal something about Trump’s core support. Baseball is a very traditional game with an older fan base, and traditionalism is probably the core value of Trump fans. Trump’s negative advertising is likely to focus on the threats to traditional values (i.e., Harris is a San Francisco liberal). Table 5: Candidate Fandom and Cultural Segments Commentary and Prediction Fandom is a powerful metric for predicting political success, but like most data points, it doesn’t tell the whole story. Fandom is a measure of unwavering core support while anti-fandom measures the group that will never support and is likely to show up to vote against a candidate. Examining fandom rates across multiple segments reveals that Harris’ core support is concentrated in specific cultural and racial segments. The analysis also suggests that Trump's core support is broader than is usually acknowledged and that his main problem is significant anti-fandom with women and minorities. Harris’ problem is a lack of love, while Trump’s is too much hate. Notably, I am not paying too much attention to the current wave of excitement and enthusiasm surrounding Harris. The recent enthusiasm is likely more a manifestation of the Democratic base’s hopes and a relentless media onslaught than an actual increase in passion for Harris. Maybe there will be a permanent shift upward in Harris’s fandom, but I don’t see any logic for why this would occur. Harris isn’t suddenly more likable or aspirational than she was last month. The argument that the American people are becoming more acquainted with her is dubious, given that she has been the Vice President or a major presidential candidate for almost five years. What are the implications for the upcoming election? Voting is not only about fandom or hate, so we must consider some additional factors. For instance, many potential voters lack passion and knowledge and are more prone to vote based on identity rather than ideology. If a region or demographic segment consistently votes for a party 75% of the time, that’s voting more based on fixed identities than current societal conditions. The American electorate has many of these types of fixed-preference voter segments. Furthermore, as the American electorate becomes more diverse, identity-based voting seems to be making presidential contests more predictable. The baseline seems to be that the Democratic candidate will win the popular vote by a few percentage points, and the Electoral College will come down to a few states, such as Michigan, Pennsylvania, and Wisconsin. Examining past electoral maps shows far more shifting of states across elections. Now, all but a handful of states are regarded as non-competitive. The Figure below shows the presidential popular vote margins for the last 50 years. It shows a trend towards smaller margins for the winning candidate, which is at least partly due to growing ethnic diversity and more fixed (at least in the near and medium terms) identity-based voting. Over the last 13 cycles, the margin of victory has dropped by about 1% every four years. Demographic change has also locked in a high baseline level of support for Democratic candidates. The last time a Republican won the popular vote was in 2004, with George Bush as the incumbent. Figure 1: Presidential Vote Margin 1972 to 2020 In addition to shrinking election margins, demographic change promises to change future campaign tones. The increasing relevance of fandom and anti-fandom, combined with the growing diversity of the electorate, will make 2024 an extremely negative campaign. The 2024 election will be determined by identity-based demographic trends and negative (anti-fandom) marketing campaigns. Demographics are destiny, and America is changing rapidly in ways that make it increasingly difficult for the Republicans to win the popular vote. It doesn’t matter if the Democrat is Harris, Newsom, Clinton, or Whitmer while the Republican is Rubio, Haley, Cruz, or Burgum. The baseline is probably 52% to 48%, D to R. Candidate fandom and anti-fandom probably shift the vote 2 or 3 percent in either direction. The correlation of demographic traits with voting behaviors creates incentives for campaign strategies that focus on identity. Republicans are eager to shift some percentage of Black or Hispanic voters to their cause because it simultaneously reduces the Democrats' base and grows Republican totals. In contrast, Democrats need to motivate marginal voters in the female, Black, and Hispanic segments to turn out. Fear-based appeals are the most effective tool for both parties' goals. Negative messaging is also prevalent because of the general view of politicians. Politicians tend to inspire more antipathy (anti-fandom) than admiration (fandom). The fandom data shows this, as both candidates have far more anti-fans than fans (this holds with other politicians) . The modern election calculus is, therefore, focused on aggressive negative ads that inspire marginal voters to take the initiative to vote against a hated candidate. Passion drives behavior, and it's far easier to drive fear and hatred of a candidate than to inspire passion and admiration. Considering the fandom data and the current electorate, I have two predictions. First, we will witness an incredibly nasty race. Harris’s best bet is to demonize Trump to motivate the anti-Trump voters to turn out. The American culture of 2024 includes constant repetition that many Democratic voting constituencies are marginalized and threatened. These segments are best motivated by using messages that cast the Republicans as the danger or oppressor. Women will fear losing reproductive rights, and African Americans will be primed with threats to voting rights. Trump will also employ negative messaging, but Trump’s adoption of a negative campaign comes from a slightly different motivation. Trump’s core support consists of conservatives who are frustrated by a lack of cultural power and representation. This group is looking for someone who will fight for their values. This desire for a “fighting advocate” explains much of Trump’s appeal, as his supporters are enthusiastic about his “mean tweets and nicknames.” There will also be fear-based advertising as Harris will be positioned as wanting to defund police and open the border. Second, Trump wins in a close contest. Comparing Trump’s and Harris’ fandom and anti-fandom suggests the Harris campaign faces an uphill challenge. Despite the current blitz of enthusiasm for Harris as a replacement for a failing Joe Biden, her “brand” has not shown an ability to stimulate passion, and her dislike levels exceed Trump's. It seems unlikely that she will be able to inspire fans. While Trump has a significant fanbase and weaknesses in terms of strong anti-fandom levels in minority and cultural segments, he probably beat Clinton in 2016 because her anti-fandom was equivalent to his. In contrast, he lost to Biden because Biden had less anti-fandom (in 2020). Kamala Harris seems more like Clinton than Biden, so look for a similar outcome as in 2016. The bottom-line prediction: An exceptionally negative campaign, with Trump’s greater baseline fandom and Harris’s charisma deficit leading to a narrow Trump victory. As in 2016,Trump wins the Electoral College while losing the popular vote. Addendum: Future Fandom Lesson The structure of the American electorate and the propensity of people to vote based on identity rather than ideology mean that negative campaigns are the standard in the near future. The essential observation is that demographic trends create an electorate that is more a collection of identity segments than a homogeneous population that varies in ideology. An increasingly diverse electorate likely means increasingly negative presidential campaigns as negative or fear-based appeals are especially effective when elections focus on threats to identity groups. The tragedy of this situation is that the negative messages of campaigns amplify racial division and acrimony. When the next election occurs, the electorate is even more polarized, and negative or fear-based appeals are again the most effective. Mike Lewis is an expert in the areas of analytics and marketing. This approach makes Professor Lewis a unique expert on fandom as his work addresses the complete process from success on the field to success at the box office and the campaign trail. Michael is available to speak with media - simply click on his icon now to arrange an interview today. Interested in following Future Fandom! Subscribe for free to receive new posts.


Top Expert Placement: NYS Legislature Fails to Pass Environmental Bills
Lawrence Levy, associate vice president and executive dean of the National Center for Suburban Studies, talked to Newsday about New York state legislators failing to pass environmental measures that would have been transformative. “It’s fair to say that in a state that has passed some of the nation’s most ambitious clean energy and other environmental protections, the failure to support additional initiatives can’t be ascribed to a lack of concern about climate change, congestion and pollution,” Levy said. “It’s primarily about the economy, primarily inflation, and general uncertainty. These are volatile times, economically and even politically.” Lawrence Levy is available to speak with media - simply click on his icon now to arrange an interview today.


Expert Research: Hurricanes and Natural Disasters Linked to “Grocery Tax” for Lower-Income Americans
Research from Goizueta’s William Schmidt uncovers the disproportionate impact of natural disasters on low-income families’ access to essentials. Global warming is accelerating severe weather with cataclysmic outcomes for communities all over the world. In 2023, the hottest year on record, no fewer than 23 weather-related disasters struck the United States. These natural disasters claimed hundreds of lives and caused $57 billion in damage. Recently, the federal government has come under scrutiny for uneven aid response to communities affected by hurricanes, fires, and flooding in America. William Schmidt But might there be other factors at play that see disadvantaged groups more vulnerable to the impact of severe weather events? Weighing into this is award-winning research by Goizueta Business School’s William Schmidt, associate professor of Information Systems and Operations Management. He and Xabier Barriola from INSEAD Business School look at the effect of three major hurricanes in the U.S. in the last 20 years. They find evidence of higher paid prices for basic groceries in the aftermath of each storm that disproportionately impact lower-income communities in affected states. In fact, says Schmidt, when severe weather hits communities, these families end up paying anywhere between one and five percent more relative to high income households for essential food and goods. This puts a major strain on already-strained resources in times of massive disruption. "We see a spike in the prices paid for household groceries of up to five percent hitting low-income groups immediately after a major storm hits." William Schmidt “Then you have to factor in the reality that poorer households spend around eight times more of their disposable income on basic groceries than high-income households,” says Schmidt. “It becomes clear that the aftermath of severe weather is harder for them to bear. And in our research, this is an effect that lasts for months, not weeks or days.” Exposing Hidden Costs on Those Hit Hardest To get to these findings, Schmidt and Barriola worked from a hunch. They figured that in low-income areas, a lack of infrastructure, lower-quality construction, and fewer grocery store outlets could translate into supply shortages in emergencies. Ensuing stockouts might then lead to knock-on price inflation for customers. These are low-income families for whom inflation has serious and significant consequences, Schmidt says. "We know that inflation hurts poorer communities. High-income families have the option of switching between high and low-priced goods according to needs or preference. But families with lower incomes are already purchasing low-priced groceries." William Schmidt “When there are disaster-induced stockouts to their preferred products, those families are forced to substitute to higher priced groceries,” Schmidt continues. Then there’s retailer behavior. Following large environmental disasters, store managers may be unable to keep necessities in stock. Under those circumstances, it is difficult to justify running promotions or implementing planned price decreases. To test these ideas, Schmidt and his colleagues looked at data from the weeks and months following Hurricanes Katarina (2005), Ike (2008), and Sandy (2012). They decided to pinpoint those locations immediately impacted at the county level. To do so, they used major disaster declarations issued by the federal government at the time. Then they integrated this with detailed grocery store sales data provided by Information Resources Inc (IRI) with zip code-level household income and demographic data from the U.S. Census Bureau. With each hurricane, the researchers looked at IRI data covering 30 different product categories and around 200 million transactions over a 12-week period. Schmidt and his colleagues then ran a set of analyses comparing prices paid by communities before and after each hurricane. They also contrasted price increases paid by low-income and high-income households as well as communities outside of the areas affected by the storms. Crunching the Numbers “Doing this triple-difference regression analysis, we find that lower-income communities pay an average 2.9 percent more for their groceries. That’s in the eight weeks following each of these disasters,” says Schmidt. "The effect varies. But it is roughly commensurate with the overall economic damage wrought by each hurricane, with Katrina being the worst. Here low-income families were seeing a 5.1 percent increase in the cost of food and basic goods, relative to richer households." William Schmidt The study points to a variety of mechanisms driving these effects. As Schmidt and his co-authors hypothesize, there is evidence that the same disruptions lead to fewer price promotions. They also see more frequent stockouts of low-priced goods. At the same time, there’s a shift in household purchasing from low to higher-priced products. These effects are long-lasting, says Schmidt. According to the study, post-hurricane inflation in the prices paid by consumers continues to affect poorer families for eight or more weeks. This amounts to months of economic hardship for those least resilient to its effects. Schmidt calls this “permanent inflation.” Pursuing Equity in Crisis Operations managers and policymakers should factor these findings into emergency relief efforts, say Schmidt and his colleague. The goal should be to service communities more equitably. So, there should be more thought to the provision of essential food and household goods. Also, there should be a particular focus on those most vulnerable to natural disasters and their effects. Current disaster nutrition relief programs are typically short. Authorities might do better by vulnerable communities by also extending things like cash and voucher programs, says Schmidt. And they should prioritize the ordering, shipment, and warehousing of essential goods. “Our research shows that hurricanes cost certain groups of Americans more than others in the longer run. The permanent inflation on food stuff and household necessities that we find constitutes an additional burden on part of our national fabric. These are people who are least positioned to afford it.” Hurricanes and the economy are both sought-after topics - and if you're covering, we can help. William Schmidt is an associate professor of Information Systems & Operations Management at Emory University’s Goizueta Business School. His research focuses on understanding and mitigating operational disruptions, and applications of machine learning in operational decision making. To connect with William to arrange an interview - simply click his icon now.


Is Florida becoming more affordable for renters?
Between high interest rates, an influx of newcomers eager for housing and inflation taking a toll on the cost of almost everything - it's been an expensive year for anyone living in Florida. But it appears the tide might be finally turning on high costs and the price to rent a place in the Sunshine State might be going down. It's a trend that has media looking for answers and experts like Florida Atlantic's Ken Johnson getting calls to provide his insight, opinion and expertise on the topic. Florida Atlantic University recently released a new study showing that the state’s rental markets might be stabilizing. In the release, FAU officials announced that rents in areas like Palm Bay and Jacksonville have recently gone below their long-term pricing trends. Meanwhile, the data indicates that other major cities in the state — such as Cape Coral, Orlando and Deltona — saw only slight increases in rent prices, with price increases gradually slowing down. As such, it could be a sign that many renters statewide could soon see lower prices. “While these measures are small, they are a positive sign of where the rental market could be heading in the future,” said Dr. Ken Johnson, a real estate economist with FAU’s College of Business. “These Florida cities are renting at a discount compared to their historical averages, and others appear to be heading in that direction, suggesting that rental markets around the state are stabilizing.” June 06 - Click Orlando.com Florida may be an interesting case study on what lies ahead. Will these rental trends in Florida start to appear nationally? Who will best benefit from lower rents and what will it mean for the economy? Will lower rents attract more people to Florida and could that reverse this trend? There's a lot to know and understand about the rental market. And if you're a journalist covering the topic or looking to know more - then let us help. Ken H. Johnson, Ph.D., an economist and associate dean in FAU’s College of Business, is available to speak to the media. Simply click on his icon to arrange an interview and time.

Changes in college football continue to be driven by dollars (and sense?)
The landscape of college sports, and particularly that of college football, has changed significantly in recent years. First, we have seen an almost constant realignment of collegiate athletic conferences, resulting in a few major mega-conferences, such as the SEC and ACC, Big Ten and Big 12, and the disintegration of a former major conference, the Pac 12. Most of the other changes related to the athletes, such as the ease with which student-athletes could transfer from one school to another and the ability for them to be paid for their name, image and likeness. All of these issues were potentially pointing to new business models in college sports, but within the last week, that landscape was shaken even further. Last week, the NCAA and its five major conferences settled multiple lawsuits to pay past and present student-athletes a total of $2.8 billion. The settlement also laid the foundation for the payments of college athletes starting in fall 2025. “The major unresolved questions are who will get paid and how much,” said Rick Franza, PhD, professor in the Hull College of Business at Augusta University. “If we ‘follow the money,’ we see that football and basketball (particularly men’s basketball) generate almost all of the revenues, and most of the revenues comes from major conferences. Therefore, most of the player payments are going to go to football and basketball, and given the size of the relative rosters, football teams will be much more costly.” Franza added that the settlement will further exasperate the revenue and cost differences between major conferences and their smaller conferences as well as between football and the so-called Olympic sports which generate little, if any revenue. It was always clear that from both a revenue and cost perspective, college football is very different from other sports. Revenues are much higher for the major conferences in football, and there is not the same extent of revenue sharing as there is in basketball due to the NCAA Tournament. On the cost side, with the new realignment of the mega conferences and expanded geographic footprints, there is a significant increase in travel costs for the Olympic sports. “While those expanded conferences were mainly driven by football revenues, they are also making all other sports more costly. Therefore, the time has come to separate football from other sports,” said Franza. One solution was first proposed by Chip Kelly, former Oregon and UCLA head football coach and now Ohio State offensive coordinator. He proposed a 64-school football conference in which the members would share all revenues, including television, which would more easily cover the NIL, and player pay costs. In recent months, similar proposals have been made for a college football “Super League,” which would include up to 80 schools. “This makes too much sense not to happen,” Franza said. “It allows the bigger football schools to share the plentiful available revenues while being able to pay the players what they will demand. At the same time, the other college sports would be able to revert to their traditional, geographical conferences and reduce travel costs driven up by the realigned mega- conferences.” He added that two conferences, the SEC and Big Ten, the most successful under the current alignment, could delay the implementation. Franza also predicts that an agreement taking the first steps toward such a structure will be reached sometime in 2024. “While it makes a lot of sense to go in this direction prior to the player settlement, it makes even more dollars and ‘sense’ now given the settlement,” said Franza. “While the SEC and BigTen currently make more money than any other conference, I think they will see the light for what is best for the future of college football.” Covering the business of sports and looking to know more? Then let us help. Richard Franza, PhD, is available to speak with media about trending issues like inflation, small business and the economy – simply click on his icon now to arrange an interview today.


Changes to Philadelphia's Tax Structure Could Represent "Pivotal" Economic Shift
On March 14, Philadelphia mayor Cherelle Parker delivered her first budget proposal in a 75-minute address to City Council. Throughout her speech, the new mayor touched on subjects ranging from corridor cleaning and housing programs to police spending and anti-violence grants. However, one set of items was absent from her $6.29 billion plan and presentation. In a break from recent administrations, Mayor Parker abstained from calling for cuts to the city's wage or business taxes. She also refrained from speaking on adjustments to Philadelphia's tax structure, which depends more heavily than other municipalities on wage taxes and has a relatively light property tax burden. Theodore Arapis, PhD, chair of Villanova University’s Department of Public Administration and an expert on fiscal policy in local governance, believes that changes to how Philadelphia levies and handles taxes, particularly on the real estate front, should be discussed further. "[Having property taxes play a larger role] represents a pivotal shift towards creating a more resilient and efficient revenue system," said Dr. Arapis, after reviewing the mayor's plan. "The current reliance on wage taxes is subject to considerable volatility, undermining fiscal stability. In contrast, property taxes offer a more inelastic and predictable revenue stream, suggesting a strategic move towards them would be beneficial for the city." Dr. Arapis also maintains that, with Harrisburg's go-ahead, Philadelphia's real estate taxes could be structured in a way that effectively facilitates business growth, while ensuring that homeowners are not unduly burdened. "Differentiating tax rates between commercial and residential properties could strike a delicate balance—spurring economic development while maintaining equitable tax distribution," he stated. "This segmentation could stimulate business activity by creating favorable conditions for commercial enterprises, which is essential for Philadelphia's economic vitality." Additionally, Dr. Arapis contends that tweaks to the city's tax abatement policy, which is currently in the process of a gradual phaseout, could further provide for inclusive and sustainable growth. "Tax abatements have been utilized as a policy tool to stimulate property revitalization and neighborhood renewal. However, these measures often carry unintended consequences that disproportionately impact existing residents," he shared. "Specifically, such incentives can precipitate a rise in property values and, consequently, a hike in the tax burdens of non-abated properties. This dynamic can exacerbate gentrification, leading to the displacement of longstanding community members. "To address the complexities of tax abatement policies in fostering affordable [and accessible] housing, a nuanced strategy is vital. A more equitable distribution of housing affordability could be achieved by, say, mandating that at least 50% of units in new developments meet affordability criteria... [and diversifying] the approach to income targeting, perhaps through a tiered system that caters to various income levels [and indexes] these categories to local inflation and wage growth." Despite the content of her first budget proposal and address, Mayor Parker likely shares some similar perspectives on tax reform and structural adjustments. Prior to entering office, during her years as a City Council member and days on the campaign trail, the acting executive worked to lower Philadelphia's wage tax, acknowledged the untapped potential of property taxes and expressed her desire for a differentiation of property tax rates. Before pursuing these measures further, as The Philadelphia Inquirer reports, Mayor Parker is probably (1) holding off until the newly announced Tax Reform Commission shares its findings, (2) ensuring that there are no immediate, major disruptions to the city's flow of revenue, as she launches her "safer, cleaner, greener" agenda, and (3) waiting for state lawmakers to make greater progress on raising the minimum wage and restructuring the Commonwealth's tax legislation, namely the uniformity clause. The mayor did, however, make one notable tax-related recommendation in her budget plan: She proposed an increase to the school district's share of real estate tax revenue from 55% to 56%, which could boost funding for the district by $119 million over five years. "The redistribution of real estate taxes between the school district and the city is commendable as an initial measure," observed Dr. Arapis. "However, without a comprehensive reform of the real estate tax system, encompassing regular property reassessments and adjustments to mill rates, this change is likely to yield only ephemeral benefits."


With the Port of Baltimore all but closed, how will the supply chain be impacted?
Following the incident of the container ship crashing into the Francis Scott Key Bridge at the Port of Baltimore and the bridge collapsing, there are now some supply chain concerns. While they may not be felt right away by consumers, there are a number of businesses that will be affected by it. Rick Franza, PhD, professor in Augusta University's James M. Hull College of Business and an expert on operations and supply chain management, said one immediate impact is where container ships will be diverted to for offloading. The Port of Baltimore is a major shipping hub and ranks first among U.S. ports for autos and light trucks. Now those ships will have to find other ports to unload their goods, which becomes a logistical problem as much as anything. “Most ports on the East Coast are at 70% to 80% capacity, which is where you want to be. You don’t want to have much more than that, but they’re going to have to,” said Franza. “It could affect a good bit of the eastern half of the United States.” Ports in Savannah, Charleston and New York, among others, will have to become the destination for those currently sitting outside Baltimore and those en route from around the world. The good news, Franza said, is that most foreign car manufacturers have plants in the United States so it will likely only affect those consumers looking for a certain brand or even a specific model. Baltimore is also one of the furthest inland ports and has the best rail service coming from it. The outbound goods coming off the ships will now face more of a transportation hurdle when they are diverted to another port. “It’s not just the capacity of the port, that’s one thing, but it’s also their capacity of the outbound items,” he said. “It may be more trucks are needed, and new routes are needed to move inventory. It now becomes a whole different set of providers for the trucks because it’s no longer the people in Baltimore.” Franza added companies will also have to decide which distribution centers they may want to use, whether it’s closer to the area they serve or closer to the port. All those factors affect where the items from overseas end up. While it’s not a good scenario, at the end of the day, he feels the consumer likely won’t see much of an impact. “First of all it’s going to take a while before we see any effect on certain things,” Franza said. “The bad news for inflation is that it’s going to raise the cost of transportation for the goods coming off the ships. Will businesses absorb the cost or pass them along to consumers?” Looking to know more? Then let us help. Richard Franza, PhD, is available to speak with media about trending issues like inflation, small business and the economy – simply click on his icon now to arrange an interview today.

MEDIA RELEASE: Voting for the CAA Worst Roads campaign is now open
Tired of swerving around potholes? Are you worried about your safety as a cyclist or pedestrian? Voting is now open in Ontario for the annual CAA Worst Roads campaign, and CAA South Central Ontario (CAA SCO) is giving citizens the opportunity to voice their concerns about the bad roads in their communities. "Our research shows that 65 per cent of members don't feel enough is being done to fix the roads," says Teresa Di Felice, assistant vice president government and community relations, CAA SCO. "This is causing a variety of concerning driving behaviours, including swerving to avoid potholes, slowing down for bad spots, and some even changing their route altogether to avoid a bad road. We encourage all Ontarians to vote for their Worst Roads and join the community of drivers, cyclists, transit riders and pedestrians committed to improving and actively working to help make our roads safer for all." Those surveyed say they spent $852 on average to repair their vehicle. According to a survey conducted by CAA SCO, 84 per cent of members worry about the state of our roads, with 42 per cent experiencing vehicle damage due to poor roads. Despite this, 82 per cent pay out of pocket to repair their vehicles, while only four per cent file a claim with insurance, and nine per cent forgo repairs altogether. "Either because of affordability or availability, many people are holding on to their cars a little longer these days; the last thing they want is expensive repair bills on an already stretched household budget. While inflation rates are cooling, many of us are dealing with a higher cost of living, making the investment in roads and supporting infrastructure more important than ever," adds Di Felice. Vehicle damage caused by potholes can range from $500 to over $2,000, with the average repair by those surveyed costing $852. "We know that the campaign works and that decision-makers are listening. Since its inception in 2003, we have seen road repairs move up and budgets prioritized. The CAA Worst Roads campaign has been a vital platform for Ontarians to nominate and vote for roads they believe need urgent attention. It covers issues like congestion, potholes, road signs, and traffic light timing for pedestrian and cycling safety." Ontario's top 10 list is verified by the Residential and Civil Construction Alliance of Ontario (RCCAO) and their members, including the Greater Toronto Sewer and Watermain Contractors Association (GTSWCA), Heavy Construction Association of Toronto (HCAT), and the Toronto and Area Road Builders Association (TARBA). "RCCAO is a proud partner and supporter of this year's CAA Worst Roads advocacy campaign, giving Ontarians a platform to raise awareness about the state of vital road infrastructure in their communities," said Nadia Todorova, executive director of RCCAO. Nominations for the Worst Roads campaign can be submitted online at www.caaworstroads.com from March 27 to April 19. Once the nominations are collected, CAA will reveal the top 10 worst roads in the province to the public. CAA conducted an online survey with 2,753 CAA SCO Members between January 10 to 19, 2023. Based on the sample size and the confidence level (95 per cent), the margin of error for this study was +/- 2 per cent.

